
Despite a decade of success, I STILL get calls asking if the current growth in the craft industry is a bubble. Since apparently no number of “non-bubble” posts can dispel this notion, for this post I decided to take a more aggressive track. I’m going to start by arguing that the U.S. actually doesn’t have as many breweries as one might expect given the current level of craft sales.
This concept may seem insane (and is admittedly intentionally provocative) in a market that has seen breweries open at a rate of ~2/day for the last few years, but I think it may be the only way to drive the point home that the growth in breweries makes sense given the number that current market demand could support.
That last sentence is key, since the whole argument for why craft isn’t a bubble is built on the foundation of beer lover demand. A bubble is the opposite of demand-driven growth – it’s a level of investment or asset price increases that isn’t fundamentally tied to demand. In case you’ve forgotten the economic train wreck that was the housing bubble, that’s exactly what happened.

This chart checks all of the boxes you’d expect to see in a bubble. Real housing prices (so controlling for the price increases of everything else) continued to rise for years, despite a sharp increase in supply (measured as new construction divided by the total number of US households, so this controls for any population growth) and the fact that American workers weren’t making any more money (for my favorite take on the rest of the financial mess that pulled down the global economy, I recommend this video). This was pure speculative behavior at its finest – and at some point it had to pop. Notice also what happened to new construction after the fact: it didn’t just go down, it cratered to its lowest level since the government started tracking construction (again, controlling for population). People had built way past the point that could be supported by demand and we still haven’t come back to 1990s levels of construction per households.
Now for breweries, a bubble would be when investment – in either the number of breweries or in their capacity – accelerates way beyond the point that market demand can support. The best measure of market demand is probably sales. So how do brewery numbers look relative to craft sales? Here’s a graph that shows an index of craft production (good proxy for total sales) versus an index for TTB brewery permits (which grew from 250 in 1990 to 6,080 in 2015). On production, I’ve controlled for changes to the data set to provide a more consistent measurement of demand. I chose to use permits rather than the active brewery number since we’d expect permits to respond more readily to current sales than breweries, which would lag based on planning time. For both, I’ve set 1990 levels equal to 100 to make the growth easier to compare.

What we see is that since 1990, production has grown faster than the total brewery number. The one time this wasn’t true – the late 1990s and early 2000s, when the index of permits caught up with the index for production – we got a shakeout. That’s exactly what you’d expect. People in the late 1990s were entering based on speculation that the market would keep growing, not based on real demand, and so there wasn’t enough market share to support all of the breweries. Today, we have a very different situation – the brewery index has been climbing largely in step with the sales index.
Now, to be perfectly clear, none of the above should be misconstrued as arguing either of the following:
- Opening a brewery now or in the future is a can’t miss bet – that’s just false. Leaving aside the fact that starting any small business is always risky and hard, where a brewery is located matters more than ever, and a national chart hides tons of local variation. Second, the growth index stops in 2015, and all signs point to slowing growth in craft sales, so we may see those lines catch up with each other in the near future.
- All breweries will thrive equally in the current market. Just like location, business model matters. Market demand doesn’t mean your brewery can capture that growth. That’s true in a growing market – and even more critical in a slow growth market. Retail channels get clogged, competitors maneuver, and different models simply require different levels of growth than others.
On point #2, here’s the incremental gain in volume (comparable bases) divided by the number of production breweries since 1990 (I’d argue brewpub demand is a different beast entirely, so I’ve excluded both their volume and their numbers).
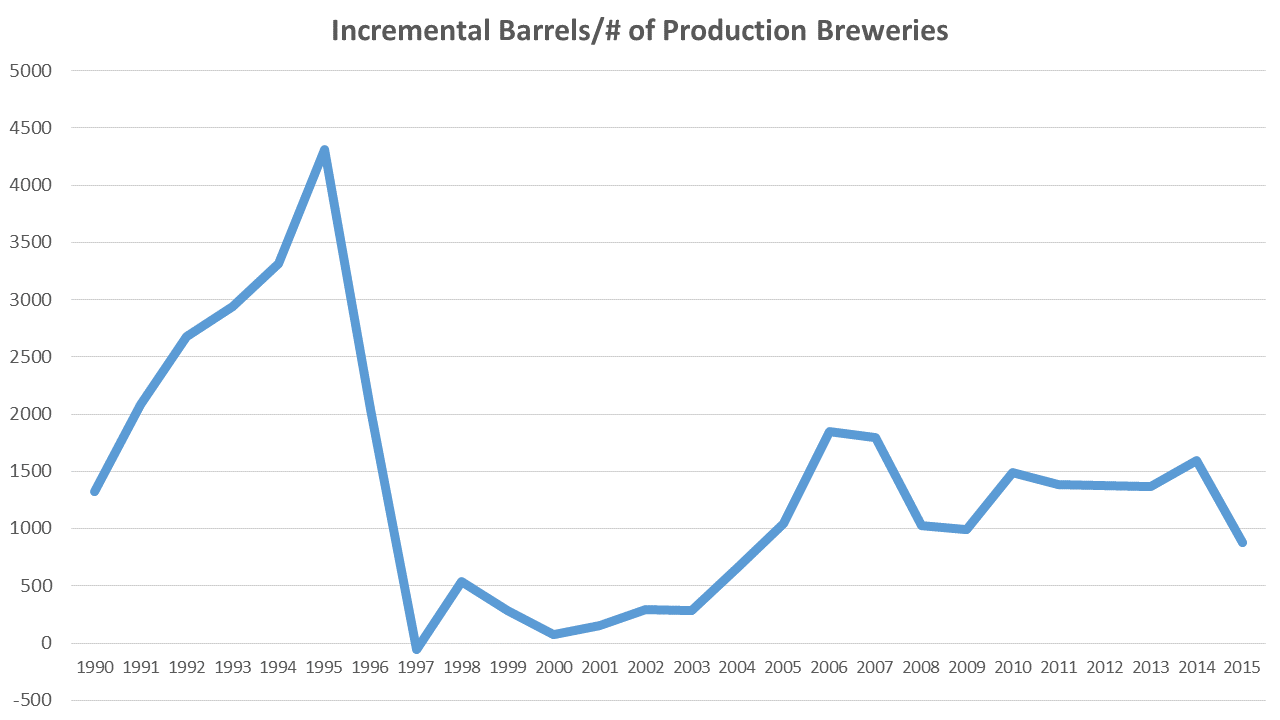
Notice again the late 1990s/early 2000s, the last period with a high % of closures. The growth wasn’t enough to spread across all models. As incremental growth slows, it becomes more likely that in order to grow volume you’ll have to take it from someone else. During periods of rapid growth, the total growth means there may be opportunities for everyone. That’s pretty clearly what the market looked like from 2005-2015 (and the 2015 ratio dropped well below the previous 5 years). 2016? We’ll see, but early reports are a more mixed bag. With more breweries than ever and slowing growth, that incremental growth/brewery number is certainly going to drop. It won’t be late 90s levels, but it’s trending that way. That won’t pose problems for breweries that don’t require much if any growth (that’s probably the majority of breweries and many more micros are adapting their models in that direction), but if you need growth every year for your business model to work, it’s probably time to re-evaluate. In this post I’ve focused more on the number of breweries instead of overall market share. It’s worth remembering that while those are related, they aren’t the same thing.
So to sum up, growth in the market, both in sales and the corresponding number of breweries, has recently been built on solid fundamentals: increasing demand that can be seen in rising sales. That doesn’t mean that growth will last forever, and all signs point to a future with slower growth in demand. A slowdown isn’t a bubble bursting and what we won’t see is a cratering number of breweries (the corresponding dive to the construction crash in the first chart).
Hopefully, the 2,000+ breweries in planning will pay attention to history and are realistic about the challenge of opening in a crowded market. Even if opportunities remain in many markets or sub-segments, a slower growth environment means more challenges. That means entrants will need to focus more than ever on quality, innovation, and differentiation in order to realize those opportunities.
For more comparisons between the late 1990s slowdown and today, check out my upcoming Sept/Oct New Brewer column: “This Time is Different”


 Resource Hub