
The CHFJPY has been trending to the upside as the CHF buying is directed toward the JPY given the SNB imposed 120.00 floor for the EURCHF and the bullishness from the JPY stimulus.
CHFJPY is on a moon mission.
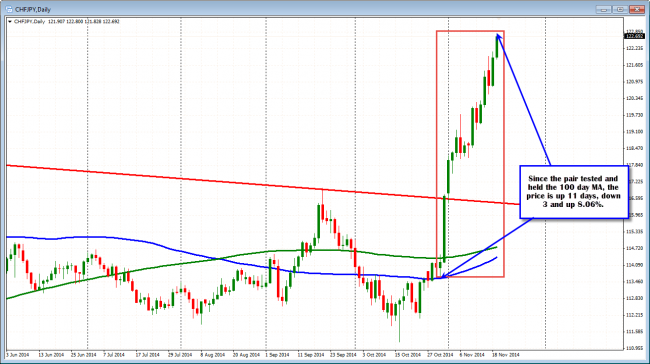
Looking at the daily chart, the pair is October 30 when the price based against the 100 day MA (blue line in the chart above), there has only been 3 modest down days and 11 up days. Since that time the price has moved from 113.637 to 122.80. That is an 8.06% increase over that time. The pair is on a moon mission. Will that continue? If the buyers continue to remain in control.
What would signal the buyers are starting to sell or new sellers are taking a shot the high is in place?
Those clues will come from the shorter term charts.
Before I outline what to look for, it is important to understand that the market is trending higher, and the fundamentals in Japan along with the suppressed CHF against the EUR, is contributing to the the buying of the CHFJPY instead. Trends are fast, directional and can go farther than you expect.
As a result, if shorts are established, be sure to define and limit risks as you will be trading against the trend fundamentally and technically.
Having said that, there are corrections of trends and there are points when the trend reverses. So looking for bearish technical clues often starts the correction/reversal process. The goal is to have a technical reason/reasons to sell. If there are none, the buyers remain in control. DON’T SELL. Stay long and enjoy the trend.
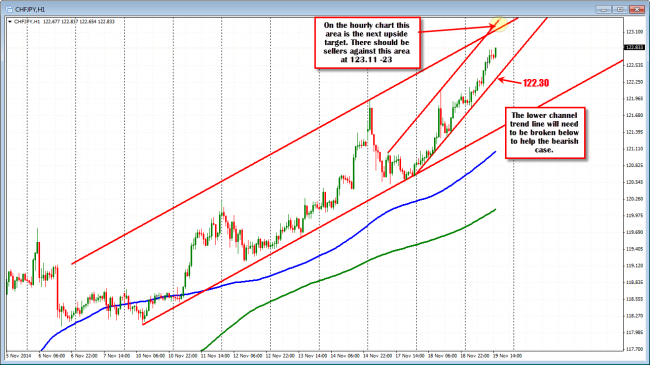
The CHFJPY on the hourly chart shows the pair in the middle of support and resistance trend lines.
Looking at the hourly chart, the pairs is trading between channel trend lines above which come in at 123.11-23 and below at 122.30. If the price should head up to the top trend line extremes (the lines are moving higher), I would expect some selling as shorts can define and limit risk against the levels. ON the downside if the lower trend line was broken, look for a move lower. Is there a reason to sell here from this chart? No. We are trading in the middle of the range.
How about a shorter term intraday chart like the 5 minute chart. Is it showing any signs of topping intraday that might lead to further selling (or at least define risk intraday)?
The pair just pushed above a double top at the 122.80 level and is testing the 122.99.level. This is the topside channel trend line. If traders long want to take a profit, this would be a level to lean against, but put a stop above (a break would next target the 122.30 level from the hourly chart if the price can remain above the 122.99 level).
If the level holds, a move below the 122.80 would be step one for the potential further corrective move lower. If the price goes above, don’t get in the way of the trend (and the next move toward the 122.30 target).
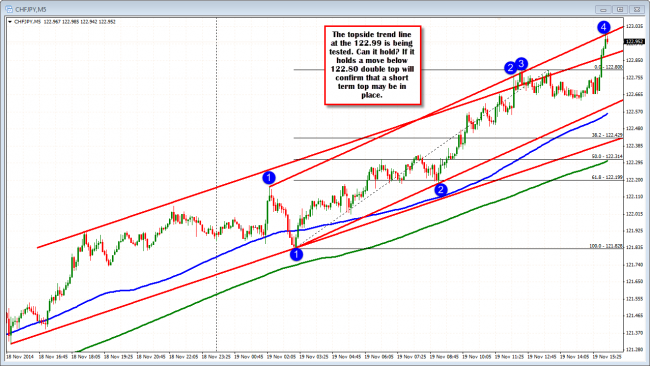
The CHFJPY is testing the topside trend line.

