


Modeling the Effects of Observational Gaps in the Sun’s Acoustic Modes
March 18, 2020
By J.Z. Keith-Hardy, S.C. Tripathy, K. Jain
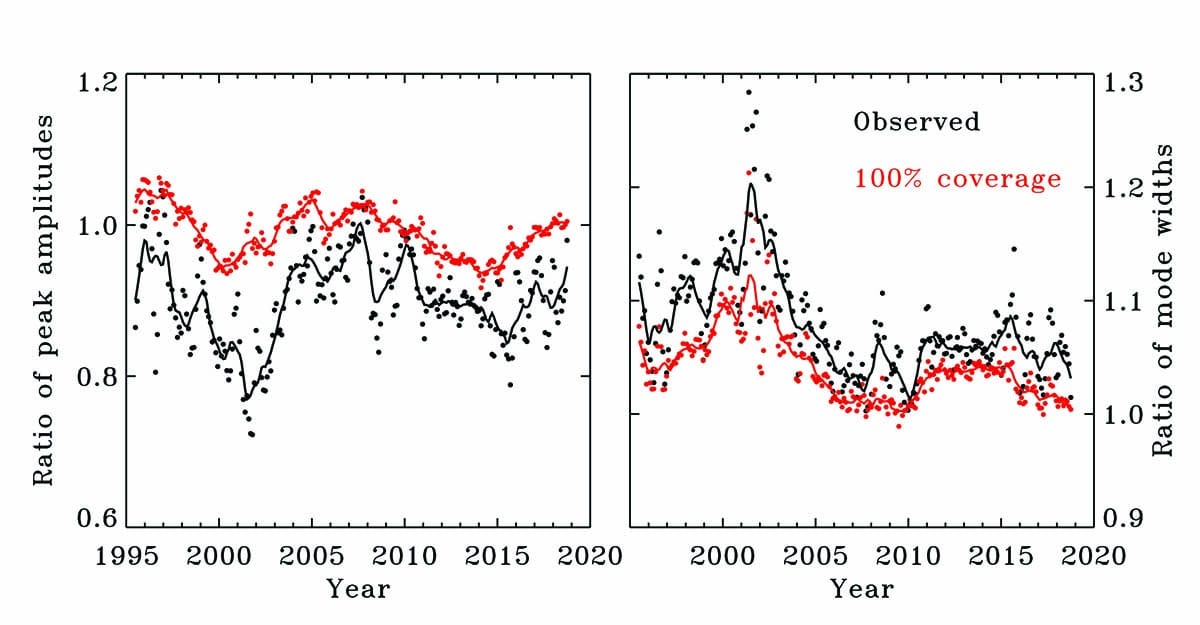
Figure shows the temporal evolution of observed (black symbols) and 100% coverage (red symbols) peak amplitudes (left panel) and mode widths (right panel). The solid lines denote one year boxcar smoothed values and illustrates the progression of Solar Cycles 23 and 24. The mean changes between the observed and corrected (100% coverage) amplitudes and widths are about 10% and 3%, respectively. The largest changes occurred during 2001-2002 when the solar activity was higher.
In our study we focus on a few different features of the waves: the frequency of the waves relate to how fast the Sun’s interior layers rotate and how “squished” the Sun is (oblateness). The mode width and peak amplitude of the waves help us understand the energy distribution inside the Sun. We investigated the impact of reduced observational coverage and the accuracy of these parameters.
Our investigation began by taking a reference data set that had high observational coverage (94% of the observations were captured) between November 1, 2008, and January 16, 2009. From this reference set, we randomly removed data points to simulate new data sets with lower observational coverage. We then studied the change our target features (frequency, mode width and peak amplitude) as the observational coverage went down.
Although we found no significant impact on frequency, mode width and peak amplitude changed significantly with the reduction in observational coverage. We used this linear relationship to correct all available data gathered by GONG to replicate 100% observational coverage. We found that our corrections greatly increased the accuracy of the data gathered by GONG, giving us a clearer understanding of the interior properties of the Sun.
Reference: Modeling the Effects of Observational Gaps on p-mode Oscillation Parameters: Astrophysical Journal, 877:148 (11pp), 2019 June 1
