Real time sentiment analysis of twitter feeds with the NASDAQ index
•
3 likes•2,312 views

We do a real-time analysis on twitter feeds computing its sentiment analysis using the hash tag #NASDAQ. This sentiment index is found to correlate well with the hourly movements of the NASDAQ index over the period 14-17th Apr 2014. In particular, a Granger causality analysis shows that the hourly movements of the NASDAQ drives tweet sentiment real-time and not vice versa during this period.
![self.stream_listener.filter(track=['nasdaq', '^IXIC'])
Whenever a Tweet arrives satisfying this filter
criterion, it will be written to a text file (tweets.tsv).
When the number of Tweets reaches the
BATCH_LOAD_COUNT, another script -
(load_data_tweets.hql) will be invoked from Tweet
Listener to load the data to HIVE from tweets.tsv.
if self.tweet_count==self.BATCH_LOAD_COUNT:
self.out_file.close()
call(["hive","-f", "load_data_tweets.hql"])
This process continues until interrupted by the user.
ii. Stock Price Listener
This component is written as a Python script and reads
the latest stock price from Yahoo Finance directly.
Stock price can be read directly from the link
http://download.finance.yahoo.com/d/quotes.csv?s=^IXIC&f=l1
Similar to Tweet Listener, this component also writes
the data into a text file (stock_prices.tsv) first. Once the
number of rows reaches a configurable
BATCH_LOAD_COUNT, another script
(load_data_stockprices.hql) will be invoked to load
data from stock_prices.tsv to HIVE.
if data_count==BATCH_LOAD_COUNT:
out_file.close()
call(["hive","-f", load_data_stockprices.hql"])
This process continues until interrupted by the user.
1.2 Data Processing Layer:
This layer is responsible for computing the aggregate
sentiment score for tweets collected over a window and
also to aggregate the stock price for the same window.
All components of this layer are invoked from a single
Python script than runs continuously. The inner
working of this layer is explained using the below flow
chart:
Figure 2: Data Processing Flow
i. Data Extractor
This component is generated from the Python script to
extract the data for a particular window. The script has
queries to extract all data with time stamp >=
start_of_window_timestamp from Tweets &
Stock_Prices tables.
fp=open('temp/extract_data.sh','w')
cmd='hive -e "select * from tweets where
time_stamp>=cast(''+time_stamp+'' as timestamp)"
>temp/tweets.txt'
fp.write(cmd+'n')
cmd='hive -e "select * from stock_prices where
time_stamp>=cast(''+time_stamp+'' as timestamp)"
>temp/stock_prices.txt'
fp.write(cmd+'n')
ii. Map Reduce Algorithm](data:image/gif;base64,R0lGODlhAQABAIAAAAAAAP///yH5BAEAAAAALAAAAAABAAEAAAIBRAA7)
Recommended
Recommended
More Related Content
What's hot
What's hot (19)
Viewers also liked
Viewers also liked (15)
Similar to Real time sentiment analysis of twitter feeds with the NASDAQ index
Similar to Real time sentiment analysis of twitter feeds with the NASDAQ index (20)
Recently uploaded
Recently uploaded (20)
Real time sentiment analysis of twitter feeds with the NASDAQ index
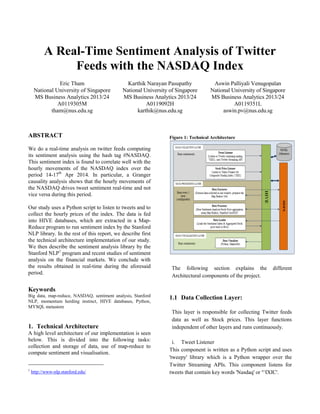
- 1. A Real-Time Sentiment Analysis of Twitter Feeds with the NASDAQ Index Eric Tham National University of Singapore MS Business Analytics 2013/24 A0119305M tham@nus.edu.sg Karthik Narayan Pasupathy National University of Singapore MS Business Analytics 2013/24 A0119092H karthik@nus.edu.sg Aswin Palliyali Venugopalan National University of Singapore MS Business Analytics 2013/24 A0119351L aswin.pv@nus.edu.sg ABSTRACT We do a real-time analysis on twitter feeds computing its sentiment analysis using the hash tag #NASDAQ. This sentiment index is found to correlate well with the hourly movements of the NASDAQ index over the period 14-17th Apr 2014. In particular, a Granger causality analysis shows that the hourly movements of the NASDAQ drives tweet sentiment real-time and not vice versa during this period. Our study uses a Python script to listen to tweets and to collect the hourly prices of the index. The data is fed into HIVE databases, which are extracted in a Map- Reduce program to run sentiment index by the Stanford NLP library. In the rest of this report, we describe first the technical architecture implementation of our study. We then describe the sentiment analysis library by the Stanford NLP1 program and recent studies of sentiment analysis on the financial markets. We conclude with the results obtained in real-time during the aforesaid period. Keywords Big data, map-reduce, NASDAQ, sentiment analysis, Stanford NLP, momentum herding instinct, HIVE databases, Python, MYSQL metastore 1. Technical Architecture A high level architecture of our implementation is seen below. This is divided into the following tasks: collection and storage of data, use of map-reduce to compute sentiment and visualisation. 1 http://www-nlp.stanford.edu/ Figure 1: Technical Architecture The following section explains the different Architectural components of the project. 1.1 Data Collection Layer: This layer is responsible for collecting Twitter feeds data as well as Stock prices. This layer functions independent of other layers and runs continuously. i. Tweet Listener This component is written as a Python script and uses 'tweepy' library which is a Python wrapper over the Twitter Streaming APIs. This component listens for tweets that contain key words 'Nasdaq' or '^IXIC'.
- 2. self.stream_listener.filter(track=['nasdaq', '^IXIC']) Whenever a Tweet arrives satisfying this filter criterion, it will be written to a text file (tweets.tsv). When the number of Tweets reaches the BATCH_LOAD_COUNT, another script - (load_data_tweets.hql) will be invoked from Tweet Listener to load the data to HIVE from tweets.tsv. if self.tweet_count==self.BATCH_LOAD_COUNT: self.out_file.close() call(["hive","-f", "load_data_tweets.hql"]) This process continues until interrupted by the user. ii. Stock Price Listener This component is written as a Python script and reads the latest stock price from Yahoo Finance directly. Stock price can be read directly from the link http://download.finance.yahoo.com/d/quotes.csv?s=^IXIC&f=l1 Similar to Tweet Listener, this component also writes the data into a text file (stock_prices.tsv) first. Once the number of rows reaches a configurable BATCH_LOAD_COUNT, another script (load_data_stockprices.hql) will be invoked to load data from stock_prices.tsv to HIVE. if data_count==BATCH_LOAD_COUNT: out_file.close() call(["hive","-f", load_data_stockprices.hql"]) This process continues until interrupted by the user. 1.2 Data Processing Layer: This layer is responsible for computing the aggregate sentiment score for tweets collected over a window and also to aggregate the stock price for the same window. All components of this layer are invoked from a single Python script than runs continuously. The inner working of this layer is explained using the below flow chart: Figure 2: Data Processing Flow i. Data Extractor This component is generated from the Python script to extract the data for a particular window. The script has queries to extract all data with time stamp >= start_of_window_timestamp from Tweets & Stock_Prices tables. fp=open('temp/extract_data.sh','w') cmd='hive -e "select * from tweets where time_stamp>=cast(''+time_stamp+'' as timestamp)" >temp/tweets.txt' fp.write(cmd+'n') cmd='hive -e "select * from stock_prices where time_stamp>=cast(''+time_stamp+'' as timestamp)" >temp/stock_prices.txt' fp.write(cmd+'n') ii. Map Reduce Algorithm
- 3. This component is written in Java and makes use of Hadoop map-reduce framework to compute the aggregate sentiment score & stock price for a window. The inner working of this component is as given below. Figure 3: Map Reduce Flow ii. Data Loader This component is responsible for loading the output of the map-reduce program to HIVE. This moves the output file from HDFS to local file system and executes the script to load data to HIVE as a repository. load data local inpath 'output/part-r-00000' into table stock_sentiments; (output directly is local, copied from HDFS) 1.3 Data Visualization Layer: This layer also works independently of other layers and is implemented using Python ‘matplotlib’ for visualization. i. Data Visualizer The below plot is a sample visualization of how sentiment index moves according to stock price for a small window (22-Apr 2 AM - 6 AM, Singapore time). The steady stock price after 4 am is due to the close of market. Figure 4: Stock Price Visualisation 1.4 MySQL Metastore The HIVE metastore service stores the metadata for Hive tables and partitions in a relational database, and provides clients (including HIVE) access to this information via the metastore service API. By default Apache HIVE is configured to use Derby as metastore. But it can handle only one active user at a time. In our case, we need multiple connections to be active with Hive at the same time for loading tweets/stock prices, for doing sentiment analysis and for visualization. One solution to this issue is to standalone database as a metastore and one popular choice is MySQL.2 2 source: Hadoop Definitive Guide
- 4. Figure 5: MySQL Metastore 2. Sentiment Analysis Library Our sentiment analysis uses the Deeply Moving library from the Stanford NLP. This is an improvement over the usual bag of words. The bag of words does a count of positive and negative words and derives the overall sentiment as such. It neglects negation and the linguistic phenomena of longer sentences. Accuracy of bag of words has not exceeded 80%3 . On the other hand, the Stanford NLP library looks at the sentence in its entirety in a recursive deep model to derive the sentiment. Its accuracy has been touted to reach 86%. The Stanford sentiment analysis uses a recursive neural network through a tree structure containing the words in the sentence marked for analysis. It is a supervised training method based on the Stanford Sentiment Treebank4 which is trained from more than 11k movie reviews that have humanly annotated. Each n–gram of words in the sentence is marked by a vector of features eg Part-of-Speech, semantics, co-occurrence which are used in its training classification and testing recursively in a tree-like structure. The tree builds itself bottom-up to include different words within the sentence. In this manner, the entire sentence can be considered for overall analysis. 3 Source of accuracy http://nlp.stanford.edu/~socherr/EMNLP2013_RNTN.pdf 4 http://nlp.stanford.edu/sentiment/treebank.html We note that this Treebank is based on movie reviews from which the supervised training is based. There may be some inherent differences in sentiment reviews from movie reviews and on stock sentiment. 3. Impact of sentiment on Financial Markets The financial markets have been known to be volatile with sudden spurts of heterscedasticity (fat tails). This is partly due to herding instinct amongst investors. Various studies have suggested that the media and financial news reporting accentuate momentum in the financial markets5 . Sentiment analysis in the financial markets is now in the mainstream as major news agencies eg Thomson Reuters have added unique twitter and news sentiment analysis into their product suite.6 Many start-up companies like InfoTrie have also added their products as add-ons to the Bloomberg news services. Aside from the traditional news media like Bloomberg, CNN and CNBC, alternative other forms of media have surfaced that are a microcosm of the investor community at large. This includes the online blogs, Facebook and Twitter. An advantage of twitter feeds over Facebook or online blogs is its frequency. The higher frequency of tweets means that it may better reflect investor sentiment in real-time. There are three potential ways on how tweets may affect the stock price movements: i. Volatility A trending (increased number of) tweets with regards to economic news may correspond to a period of increased volatility in the stock markets. This is logical considering that aside from the news agencies, traders and investors alike may ‘tweet’ more often during this period. However, there were no significant economic releases7 over the week of Apr 14-17 for us to test this hypothesis. 5 http://stocktwits.com/research/Predictability-of-stock-market- behavior-using-stocktwits-sentiment-and-posting- volume_NunoOliveira.pdf for example predicts the study of the stock prices with sentiment from StockTwits, a micro online blog and the volume being traded. Momentum in trading has probably caused a herding instinct which causes stock prices to overshoot their ‘equilibrium’ price. Similarly in down markets, fear generated by the media or online buzz may cause prices to plummet more than they should. 6 http://thomsonreuters.com/press-releases/022014/Thomson- Reuters-Adds-Unique-Twitter-and-News-Sentiment-Analysis- to-Thomson-Reuters-Eikon 7 Significant economic releases that may affect the NASDAQ will include the FED statements or the Labour Department reports.
- 5. ii. Event Study & Correlation analysis: Aside from the increased number of tweets, studies have also been done that categorises the polarity and subjectivity of the tweets in events and its relation to stock price movements. iii. Momentum Trading Strategy Another use of tweets can also be as a predictor of stock trends. Momentum strategy is much researched and based on herding instinct of traders. It is based on a feedback loop of investor sentiment back into rising or falling markets. A question to ask: do traders or news agencies tweet more often in trending markets? If so, is this a Bayesian probabilistic event having some predictability on the markets? 3.1 Lead-lag analysis In our study on the tweets, we studied hourly tweets in a week and graphed it against the index movement. This is found to have a strong correlation as seen in the figure below, where both the sentiment index and the NASDAQ trend upwards. The Pearson correlation analysis of the sentiment index with the NASDAQ index is 0.1 considering all hours.8 Ignoring non-trading hours, this correlation is 0.25. Considering that on average stock return correlations are ~0.1, this is relatively high. Figure 6: Sentiment Index and NASDAQ time series 8 The NASDAQ is traded only from 0900 to 1600 EST whilst tweets collected round the clock provide a sentiment index. We had assumed the NASDAQ index to be constant during non-trading hours which would have inadvertently lowered the correlation. Predictability of Tweets from Index or Vice Versa We further do a simple granger causality9 analysis testing against a lead lag order of 1 to 3 hours. The results from R output for the null hypothesis of sentiment to not granger cause the NASDAQ index: grangertest(NASDAQ~Sentiment, order =1,data=data) Model 1: NAS ~ Lags(NAS, 1:2) + Lags(Sent, 1:2) Model 2: NAS ~ Lags(NAS, 1:2) Res.Df Df F Pr(>F) 1 25 2 27 -2 2.0128 0.1547 For lags of up to 3, the F stat is not significant at the 5% level thus not rejecting the null hypothesis. The results from R output for sentiment with the null hypothesis to not granger cause NASDAQ are: grangertest(Sentiment~NASDAQ, order =1,data=data) Model 1: Sent ~ Lags(Sent, 1:1) + Lags(NAS, 1:1) Model 2: Sent ~ Lags(Sent, 1:1) Res.Df Df F Pr(>F) 1 28 2 29 -1 4.0874 0.05285 . Signif. codes: 0 ‘***’ 0.001 ‘**’ 0.01 ‘*’ 0.05 ‘.’ With the t-stat statistically significant at ~5%, the null hypothesis is rejected. The NASDAQ thus granger causes the tweets sentiment level. Examination of tweets We next examine the tweets that are downloaded. There are in all 17k tweets over 4 days x 24 hours. This works out to 177 tweets per hour, which is our measure of analysis. Most of the tweets are ‘reporting’ in nature, which substantiates the study result that the NASDAQ movements granger causes the tweets sentiment. Some examples of the tweets are: 9 The test statistic of the Granger test is the F-stat Where s1 is the sum of squared errors of the OLS of y against lagged y up to order n and s2 is the sum of squares of the OLS of y against lagged y and x to order n.
- 6. 2014-04-15 18:49:25|@cnbc - newest update on how 29 Nasdaq co bear market Territory. That's significant – 2014-04-15 18:48:19|Nasdaq comp almost positive after (1.9%) loss earlier - what a joy ride for the liquidity machines. #HFT $QQQ 2014-04-15 18:46:26|Money_Mystery Alert@ As expected Nasdaq hits 3966 and took support...now back to 4000 Whilst there are tweets that are ‘analytical in nature’ and potentially drives markets, these are few and far in between. Examples are: 2014-04-15 18:46:27|$AAPL $FB $GOOGL $TWTR What-If NASDAQ falls another 5% from current levels. "CAPM" analysis on a portfolio. 2014-04-15 18:05:19|RT @hakanKRBN: $NASDAQ watching for reversal ..I think 1997 scenario in play. 2014-04-15 18:03:37|Deeper selloff it this happens. If yield curve drops below 2.6 watch out below. #NASDAQ We further premise that the week of 14-17 Apr is a quiet week, and just before the long Easter break. This is a period of low volatility and had no significant news events. As such, there is no feeding of investor sentiment back into the NASDAQ or stock prices in a ‘feedback loop’, which the authors had described as momentum herding. 4. CONCLUSION Our Map Reduce program and subsequent statistical analysis have shown that in times of low volatility, it is the stock market (NASDAQ) that drives tweets sentiment in a more ‘reporting’ mode. This is premised on data that is collected in the week of 14-17 April before the Easter break with no major events. The technical architecture program that we have built is very scalable with a HIVE repository, a generalized Map reduce program and a real-time direct API to the twitter. This may be used in other application which will be useful to the authors. 5. ACKNOWLEDGMENTS Our thanks to Prof Tan Kim Leng for his teaching and guidance during the course of the Big Data module.