eXp Realty International Corp. (OTCQB: EXPI): Cloud-Based Real Estate Brokerage With Strong Growth - Initiating Coverage
•
1 like•1,593 views

Fundamental Research initiates converge (EXPI-OTCQB). eXp Realty International Corp. (OTCQB: EXPI): Cloud-Based Real Estate Brokerage With Strong Growth - Initiating Coverage Issues BUY with $3.50 target for "fair value"

Recommended
Recommended
More Related Content
What's hot
What's hot (20)
Viewers also liked
Similar to eXp Realty International Corp. (OTCQB: EXPI): Cloud-Based Real Estate Brokerage With Strong Growth - Initiating Coverage
Similar to eXp Realty International Corp. (OTCQB: EXPI): Cloud-Based Real Estate Brokerage With Strong Growth - Initiating Coverage (20)
More from Follow me on Twitter @Stockshaman
More from Follow me on Twitter @Stockshaman (20)
Recently uploaded
Recently uploaded (20)
eXp Realty International Corp. (OTCQB: EXPI): Cloud-Based Real Estate Brokerage With Strong Growth - Initiating Coverage
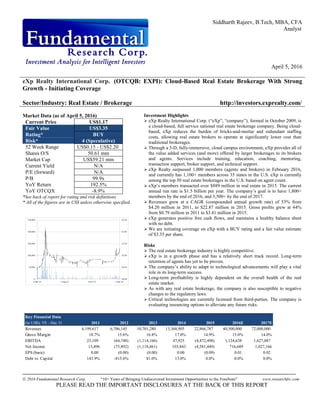
- 1. Siddharth Rajeev, B.Tech, MBA, CFA Analyst April 5, 2016 2016 Fundamental Research Corp. “10+ Years of Bringing Undiscovered Investment Opportunities to the Forefront” www.researchfrc.com PLEASE READ THE IMPORTANT DISCLOSURES AT THE BACK OF THIS REPORT eXp Realty International Corp. (OTCQB: EXPI): Cloud-Based Real Estate Brokerage With Strong Growth - Initiating Coverage Sector/Industry: Real Estate / Brokerage http://investors.exprealty.com/ Market Data (as of April 5, 2016) Current Price US$1.17 Fair Value US$3.35 Rating* BUY Risk* 4 (Speculative) 52 Week Range US$0.15 - US$2.20 Shares O/S 50.61 mm Market Cap US$59.21 mm Current Yield N/A P/E (forward) N/A P/B 99.9x YoY Return 192.5% YoY OTCQX -8.9% *See back of report for rating and risk definitions * All of the figures are in US$ unless otherwise specified. Investment Highlights eXp Realty International Corp. (“eXp”, “company”), formed in October 2009, is a cloud-based, full service national real estate brokerage company. Being cloud- based, eXp reduces the burden of bricks-and-mortar and redundant staffing costs, allowing real estate brokers to operate at significantly lower cost than traditional brokerages. Through a 3-D, fully-immersive, cloud campus environment, eXp provides all of the value added services (and more) offered by larger brokerages to its brokers and agents. Services include training, education, coaching, mentoring, transaction support, broker support, and technical support. eXp Realty surpassed 1,000 members (agents and brokers) in February 2016, and currently has 1,100+ members across 35 states in the U.S. eXp is currently among the top 50 real estate brokerages in the U.S. based on agent count. eXp’s members transacted over $889 million in real estate in 2015. The current annual run rate is $1.5 billion per year. The company’s goal is to have 1,800+ members by the end of 2016, and 3,500+ by the end of 2017. Revenues grew at a CAGR (compounded annual growth rate) of 53% from $4.20 million in 2011, to $22.87 million in 2015. Gross profits grew at 44% from $0.79 million in 2011 to $3.41 million in 2015. eXp generates positive free cash flows, and maintains a healthy balance sheet with no debt. We are initiating coverage on eXp with a BUY rating and a fair value estimate of $3.35 per share. Risks The real estate brokerage industry is highly competitive. eXp is in a growth phase and has a relatively short track record. Long-term retention of agents has yet to be proven. The company’s ability to adapt to technological advancements will play a vital role in its long-term success. Long-term profitability is highly dependent on the overall health of the real estate market. As with any real estate brokerage, the company is also susceptible to negative changes to the regulatory laws. Critical technologies are currently licensed from third-parties. The company is evaluating insourcing options to alleviate any future risks. Key Financial Data (in US$); YE - Dec 31 2011 2012 2013 2014 2015 2016E 2017E Revenues 4,199,617 6,706,145 10,701,280 13,368,905 22,866,787 40,500,000 72,000,000 Gross Margin 18.7% 15.6% 16.8% 17.0% 14.9% 15.0% 14.0% EBITDA 23,109 (64,740) (1,114,166) 47,925 (4,472,498) 1,124,638 1,627,887 Net Income 13,496 (75,492) (1,118,861) 103,843 (4,581,449) 716,689 1,027,166 EPS (basic) 0.00 (0.00) (0.00) 0.00 (0.09) 0.01 0.02 Debt to Capital 143.9% -815.6% 81.0% 13.0% 0.0% 0.0% 0.0%
- 2. Page 2 2016 Fundamental Research Corp. “10+ Years of Bringing Undiscovered Investment Opportunities to the Forefront” www.researchfrc.com PLEASE READ THE IMPORTANT DISCLOSURES AT THE BACK OF THIS REPORT Need for Real Estate Brokers Buying a house is one of the most important decisions of a household and purchasing it through a real estate broker / agent continues to be the most common purchase method. According to the National Association of Realtors (“NAR”), approximately 87% of buyers recently purchased their home through a real estate agent / broker (up from 69% in 2001), 8% purchased directly from a builder or builder’s agent, and 5% directly from previous owners. In the case of sellers, approximately 89% of sellers used a real estate agent when selling their home. For-Sale-by-Owner (“FSBO”) sellers accounted for just 8%, and such properties are typically sold to someone the seller knows. Method Used by Homeowners to Sell Their Homes Source: NAR The following table shows the results of a survey conducted by the National Association of Realtors (“NAR”) in their 2016 Home Buyer and Seller Generational Trends Report. The survey showed buyers felt that real estate agents were mainly useful for their knowledge of the buying process, help in finding the right home, and to negotiate better price and terms. Source: NAR
- 3. Page 3 2016 Fundamental Research Corp. “10+ Years of Bringing Undiscovered Investment Opportunities to the Forefront” www.researchfrc.com PLEASE READ THE IMPORTANT DISCLOSURES AT THE BACK OF THIS REPORT Fragmented Real Estate Brokerage Industry In their 2015 report, the NAR stated that FSBOs sold for less than the selling price of agent assisted homes. FSBO homes sold at a median price of $210,000, lower than the overall median of $245,000. The NAR’s survey also pointed out that 88% of buyers would use their agent again or recommend their agent to others. These results, we believe, strongly indicate that real estate agents and brokers will continue to play a key role in the industry for the foreseeable future. Real estate professionals can be broadly classified into two types – brokers and agents. A person selling real estate must be licensed by the state in which he/she works either as an agent or as a broker. A real estate broker is a person who can work alone or they can hire real estate agents and run their own brokerage firm. A real estate agent is someone who is licensed to sell real estate, but is not allowed to work independently and must be employed by a broker. If a broker or agent is a member of the NAR, they become a Realtor®. The ARELLO (Association of Real Estate License Law Officials) estimates that there are about 2 million active real estate licensees (brokers and agents) in the U.S. However, the NAR had only 1.15 million members as of March 2016. The NAR’s membership had hit a high of 1.37 million in October 2006. The following chart shows membership levels since 2005, which peaked prior to the 2008 recession, and have been rising since 2012. According to the last US Economic Census, there were 91,850 real estate brokerage firms operating in the U.S. in 2013, down from record levels of 109,472 in 2007.
- 4. Page 4 2016 Fundamental Research Corp. “10+ Years of Bringing Undiscovered Investment Opportunities to the Forefront” www.researchfrc.com PLEASE READ THE IMPORTANT DISCLOSURES AT THE BACK OF THIS REPORT Offices of Real Estate Agents & Brokers Source: US Census Bureau The number of real estate firms by employment size is shown in the chart below. There are only three firms with 1,000+ employees, nine firms with 500+ employees, and 132 firms with 100+ employees. Approximately 10,573 firms have 4 to 100 employees. Most importantly, 81,145 firms (88% of the total) have 1 - 4 employees, clearing indicating the highly fragmented nature of the real estate brokerage industry. Source: US Census Bureau
- 5. Page 5 2016 Fundamental Research Corp. “10+ Years of Bringing Undiscovered Investment Opportunities to the Forefront” www.researchfrc.com PLEASE READ THE IMPORTANT DISCLOSURES AT THE BACK OF THIS REPORT The top real estate brokerage franchises in the U.S. are listed below: Keller Williams Realty Inc. (700+ offices and 130,000+ agents) – one of the largest privately held global residential real estate brokerage, and the largest real estate franchise by agent count in North America. Realogy (NYSE: RLGY / 13,600 offices and 250,000+ agents worldwide) – business units include brand names such as Coldwell Banker, Century 21, Better Homes, ERA, Sotheby’s International Realty, etc. RE/MAX (NYSE: RMAX / 100,000+ agents) Berkshire Hathaway (NYSE: BRK.A) HomeServices is a real estate brokerage with 42,000+ agents and 1,200 offices in 47 states. Real estate brokers either choose to franchise one of the larger brokerages or run their own independent brokerage firms. The NAR states that 57% of their Realtors® are affiliated with independent, non-franchised real estate brokerages. The major advantages of franchising from large real estate brokerages are their national exposure, brand recognition, technological infrastructure, formal training programs, large listing inventory, etc. However, these features / services come at a high cost (franchise and royalty fees), and therefore, a significant number of brokers choose to start their own independent non- franchised brokerages, resulting in the highly fragmented industry. The typical franchise fee is $10,000 to $30,000 for a term of 3 to 5 years, and ongoing royalties of 5% of the total revenues. Smaller independently owned firms also offer brokers / agents more flexibility, which is another factor that has been driving professionals to such firms. The following chart shows the increase in the number of independent brokerages and real estate professionals.
- 6. Page 6 2016 Fundamental Research Corp. “10+ Years of Bringing Undiscovered Investment Opportunities to the Forefront” www.researchfrc.com PLEASE READ THE IMPORTANT DISCLOSURES AT THE BACK OF THIS REPORT Healthy Housing Market Outlook The typical profile of a NAR Realtor® is described below: 58% of all Realtors® are female, and the median age is 57. Members typically had careers in other fields prior to real estate. Median real estate experience: 12 years Median tenure at present firm: 5 years Most Realtors® work 40 hours per week. Typical member is an independent contractor affiliated with an independent company catering to local markets. The median gross income of Realtors® was $45,800 in 2014. 19% of the members (approximately 210,000) earned gross income of less than $10k, while 24% (approximately 260,000) earned more than $100k The following chart shows the strong increase in existing home sales in the U.S. since the recession. In 2015, 5.25 million homes were transacted, up from 4.94 million homes in 2014, reflecting a 6.3% YOY increase. The sale price of existing homes increased YOY from $208k to $222k in 2015, reflecting a 6.8% YOY increase. The following chart shows the average sale price of existing single- family houses in the U.S.
- 7. Page 7 2016 Fundamental Research Corp. “10+ Years of Bringing Undiscovered Investment Opportunities to the Forefront” www.researchfrc.com PLEASE READ THE IMPORTANT DISCLOSURES AT THE BACK OF THIS REPORT Overview of eXp Realty Source: Y Charts They key economic indicators (gross domestic product growth, unemployment rate, etc.) are expected to improve in 2016 and 2017, and the historically low interest rate environment, we believe, will continue to support a healthy residential real estate market in the near-term. U.S. Economic Outlook: February 2016 2014 2015 2016E 2017E Real GDP 2.40% 2.40% 1.50% 2.80% Unemployment 6.20% 5.30% 4.80% 4.70% Mortgage Rates (1-year adjustable) 2.40% 2.50% 3.00% 3.80% Existing Home Sales -2.90% 6.30% 2.50% 3.20% New Single Family Sales 1.90% 14.60% 12.70% 16.90% Existing Home Prices 5.70% 6.80% 4.40% 3.40% New Home Prices 5.20% 3.80% 2.40% 2.70% Source: NRA We estimate that the U.S. real estate brokerage industry is approximately $62 billion per year. This is based on the assumption that approximately 90% of the 5.25 million homes are sold through agents at an average price of $0.22 million per house, based on an average commission rate of 6%. Recognizing the challenges of the fragmented brokerage industry, Glenn Sanford formed eXp Realty in October 2009, with the objective of creating a cloud-based, full service national real estate brokerage company. Being cloud-based, the model reduces the burden of bricks-and-mortar and redundant staffing costs, allowing brokers / agents to conduct their business and be a part of a larger brokerage at a significantly lower cost than traditional brokerages. Moreover, Mr. Sanford realized that through a 3-D, fully-immersive, cloud office environment, the model can provide all of the value added services (and more)
- 8. Page 8 2016 Fundamental Research Corp. “10+ Years of Bringing Undiscovered Investment Opportunities to the Forefront” www.researchfrc.com PLEASE READ THE IMPORTANT DISCLOSURES AT THE BACK OF THIS REPORT Value Added Services offered by larger brokerages. By offering value added services via the cloud, and through a lower fee structure, Mr. Sanford aims to attract brokers / agents across the country and build a national brokerage. The company went public in 2013 through a reverse takeover (“RTO”) of OTC listed Desert Canadians Ltd. The following chart shows the company’s current structure. Source: Company eXp Realty, LLC is the operating entity and is 100% owned by eXp Realty International Corporation. eXp Realty, LLC has three subsidiaries - eXp Realty Canada, Inc. (which is licensed to do business in Calgary, Alberta and Toronto, Ontario), eXp Realty of California, and eXp Realty of Connecticut. In addition to the brokerage business, eXp also has a majority interest in First Cloud Mortgage Inc., a recently formed mortgage broker (discussed later in the report). In the following sections, we present the key offerings of eXp. The company operates through the website: http://exprealty.com. This platform allows buyers to search for property listings, and sellers to list their properties and gain exposure to the various markets operated by eXp. The backbone of eXp’s infrastructure is the 3D, fully- immersive, cloud office environment, which includes conference rooms, training centers,
- 9. Page 9 2016 Fundamental Research Corp. “10+ Years of Bringing Undiscovered Investment Opportunities to the Forefront” www.researchfrc.com PLEASE READ THE IMPORTANT DISCLOSURES AT THE BACK OF THIS REPORT and individual offices for management, staff, agents and brokers to meet and interact on a daily basis. Management’s objective is to promote an organizational culture, extended collaboration between management and agents, brand loyalty, etc. which will increase stickiness and agent retention over the longer-term. The following points highlight the key offerings to brokers / agents: eXp’s cloud office has a fully-staffed transaction and administration office, and a fully-staffed web development, search engine optimization and technical support office. Images of the cloud offices are shown below:
- 10. Page 10 2016 Fundamental Research Corp. “10+ Years of Bringing Undiscovered Investment Opportunities to the Forefront” www.researchfrc.com PLEASE READ THE IMPORTANT DISCLOSURES AT THE BACK OF THIS REPORT eXp’s staff provides brokers / agents training, education, coaching, mentoring, transaction support, broker support, and technical support. Agents are offered over 15 hours of professional development and business coaching every week. In March 2015, eXp launched their online RE Tech Campus for professional development and educational opportunities for real estate professionals across the industry irrespective of the brokerage or brand affiliation. The program offers training sessions by industry experts and coaches.The idea here is that, through an open education platform, the company will be able to demonstrate its offering to agents and brokers of other firms, and potentially attract those professionals to join eXp. The eXp Cloud Campus platform offers members a full suite of back office functions, including paperless file sharing and transaction management, web design, social media, digital campaigns, customer relationship management platforms, business coaching, etc. More importantly, management envisions that through their campus, and other channels, eXp will provide an environment for professionals to socialize professionally and personally. Allows both brokers and agents to leverage the company’s infrastructure to build scalable teams of agents across various regions. As eXp maintains membership in a large and growing number of multiple listing services (“MLS”) across North America (currently at 87), management of eXp believes that they have the capability to offer a robust, high-quality lead generation program to its members at a significantly lower cost than leads sold by third-party data syndicators (database companies), such as REALTOR.com, Market Leader, Zillow (Nasdaq: Z), Trulia, etc. Lead generation is critical for brokers/agents and we believe eXp’s ability to provide strong lead generation at reasonable prices, will determine their ability to retain agents over the long-term. Currently, over 10% of the members are signed up for eXp’s lead generation program, called “Making It Rain”, which starts at $100 per month. Management states that the leads generated so far costed between $7 - $25 / lead for the members, which is significantly lower than third party syndicators. The company has hired a strong team to support the senior management team. Brief biographies of the key staff, as provided by the company, follows: Gene Frederick Top recruiter for Keller Williams in 4 years out of 10 years, including 2005, 2006, 2012 and 2013. Grew Austin NW market center from 320 agents to over 600 agents. Prior to that was Regional Director of Keller Williams Virginia from 2007-2009. Previously been recognized as one of the Top 20 agents in the State of Texas. In order to join eXp, divested his ownership interest in the Northern California region, as well as interests in market centers located in Dallas, TX; Cupertino, CA;
- 11. Page 11 2016 Fundamental Research Corp. “10+ Years of Bringing Undiscovered Investment Opportunities to the Forefront” www.researchfrc.com PLEASE READ THE IMPORTANT DISCLOSURES AT THE BACK OF THIS REPORT Fee Structure Amarillo, TX; Alexandria, VA; Carmel, CA; and, Palo Alto, CA. Brad Andersohn - Director of Education and Industry Outreach Built ActiveRain University - #1 Most Subscribed Blogger Created and Managed Zillow Academy (1000+ webinars for more than 75,000 agents) Inman News - Top 50 Most Influential Online Vikki Bartholomae - Director of Agent Development Keller Williams’ Team Leader for 6 years As a team leader, reported the following YOY gains : 521% in net agent gain, 35% in agent production, and 56% in total profit As an agent: a) Increased personal production from $2 million to $18 million in 4 years. b) Built a farm area with 38% market share for listings, and c) Created mentor program for new agents. eXp currently licenses its cloud campus technology from an unrelated private company. The company is evaluating options to insource all the critical aspects related to their platform, either through acquisitions or through other 3D immersive platforms. In addition, the company is working to consolidate several of the disparate systems through the development of their own end to end technology platform internally referred as the eXpEnterprise. Management believes the cost to implement this will likely be $150,000 - $200,000 per year initially, and ongoing hosting costs of $60,000 - $80,000 per year. The average commission rate for single-family homes valued at under $1 million is approximately 6% in the U.S. After a house is sold, the commission is split (3% each) between the buyer’s and the seller’s brokers. The brokers in turn pay their agents a share (typically 50% to 90%) of the commissions they receive. The following table shows the flow of commissions generated from a $0.50 million property transaction. Commissions on a property sale Property Price $500,000 Commission @ 6% $30,000 Price Received by Seller $470,000 Buyer's Broker (3%) $15,000 Seller's Broker (3%) $15,000 Buyer's Agent (80% share) $12,000 Seller's Agent (80% share) $12,000 Real estate agents typically generate income in the following ways: Commission split: broker and agent split gross commission based on an agreed upon percentage.
- 12. Page 12 2016 Fundamental Research Corp. “10+ Years of Bringing Undiscovered Investment Opportunities to the Forefront” www.researchfrc.com PLEASE READ THE IMPORTANT DISCLOSURES AT THE BACK OF THIS REPORT 100% commission: agent retains 100% of the commission, but makes a monthly fee to the broker as a “desk fee”. Commission cap: an agent pays the broker a standard split on commission until a certain limit (“cap”) is reached; the agent retains 100% of the commissions thereafter. Salary: An agent is paid a salary per year by the brokerage. eXp has adopted the commission cap structure. The table below clearly indicates eXp’s low fee structure versus traditional brokerages: eXp Traditional Brokerages Setup Fee $99 $0 - $500 Ongoing Fee $50 per month (technology fee) + $420 per year for eXp University $50 - $500 per month Commission split 80% of the first $80,000, and 100% thereafter agents typically receive 50% - 90% *does not include broker review / insurance costs *Once an agent moves to 100% commission split, eXp charges a fee of $275/transaction on the next 20 transactions, and then $100/transaction until the year-end. Fixed Monthly Fees: eXp charges a monthly technology fee of $50, and an annual fee of $420 for the eXp University, which includes professional development classes, training programs, and other related programs mentioned earlier in this report. This compares favorably to the monthly fees (typically $50 to $500) charged by traditional brokerages. Commission Split: eXp’s agents receives 80% of first $80,000 generated through commissions, and 100% of any amounts thereafter, implying that eXp’s share of commissions is capped at $16,000. This feature is very attractive for top performing agents. For example a top performing agent, generating $500,000 in annual commissions, with a 80% : 20% split with a traditional brokerage, has to pay $100,000 to the brokerage. The same agent will only have to pay $16,000 to eXp. Residual income plans – Agents and brokers of eXp can also generate residual income by attracting other agents / brokers to the eXp platform. eXp offers a 7-level gross revenue sharing plan, wherein agents / brokers can realize monthly and annual residual income from transactions completed by agents and brokers who they have attracted.
- 13. Page 13 2016 Fundamental Research Corp. “10+ Years of Bringing Undiscovered Investment Opportunities to the Forefront” www.researchfrc.com PLEASE READ THE IMPORTANT DISCLOSURES AT THE BACK OF THIS REPORT Growth and Expansion Agent ownership – In order to encourage brand loyalty, eXp introduced equity incentive programs in 2015, wherein agents and brokers could become eligible for performance based awards through eXp’s “Icon Agent Program”. As per the program, top performing agents can receive their personal cap ($16,000 paid to eXp) back in eXp’s shares upon achieving certain milestones. In addition, eXp will also issue shares to all agents (subject to a three year vesting period) upon achieving the following milestones. Management indicated to us that these equity awards will decline as the company hits certain net agent counts. The company also introduced a program wherein agents and brokers could elect to be paid 5% of their commissions in the form of restricted common shares, at a 20% discount to the market price. According to management, currently 37% of the agents/ brokers are part of the program. We believe such initiatives are an excellent strategy to improve brand loyalty and agent retention in an industry that otherwise has higher turnover and attrition rates. eXp Realty surpassed 1,000 members in February 2016, and is currently at 1,100+. The following chart shows the key milestones since inception of the platform. eXp is currently among the top 50 real estate brokerages in the U.S. based on agent count.
- 14. Page 14 2016 Fundamental Research Corp. “10+ Years of Bringing Undiscovered Investment Opportunities to the Forefront” www.researchfrc.com PLEASE READ THE IMPORTANT DISCLOSURES AT THE BACK OF THIS REPORT According to the company, eXp agents transacted $889 million in real estate from 3,667 transactions (average - $242k) in 2015. Management estimates the current annual run rate to be approximately $1.5 billion per year. The company has transacted over $2 billion since inception in October 2009. eXp generated $22.87 million in revenues in 2015, with a gross profit of $3.41 million. Revenues and gross profit in 2011 were just $4.20 million and $0.79 million, respectively. To put things in perspective, the company can generate approximately 3% of total transactions in revenues, implying $45 million in revenues from $1.5 billion in transactions a year. Gross margin is estimated to be approximately 15%, implying gross profit of $6.75 million. eXp was launched in October 2009 with a small number of agents in Washington and Arizona. The company now has members in 35 U.S. states and one province in Canada (Alberta). The following map shows the distribution of agents / brokers by state. The company entered the Canadian market in 2014. Canada accounted for 6% of total revenues in 2015. The company’s primary near-term strategy is to continue growing in the U.S. The following points highlight a few of the key strategies adopted by management to grow the membership base: Ongoing commitment to enhancing agent ownership opportunities. Increased opportunities for professional development and social events to strengthen relationships among members. Develop applications (“apps”) which provide more functionality to members.
- 15. Page 15 2016 Fundamental Research Corp. “10+ Years of Bringing Undiscovered Investment Opportunities to the Forefront” www.researchfrc.com PLEASE READ THE IMPORTANT DISCLOSURES AT THE BACK OF THIS REPORT Competition First Cloud All of eXp’s agents and brokers are classified as independent contractors. In addition, the company has a managing broker each in every state, who are classified as part-time employees to fulfill state / local real estate business requirements. The company’s goal is to have 1,800+ members by the end of 2016, 3,500+ by the end of 2017, and 10,000+ by 2020. eXp basically competes with local, regional and national real estate brokerages to attract agents, teams of agents, brokers and consumers. From our research, we believe eXp is the only national real estate brokerage in the U.S. using a 3D immersive office environment in place of physical brick and mortar locations. We believe their fee structure and the value- added services clearly offer eXp a strong competitive advantage. Their ability to attract 1,000+ agents, and over $2 billion in transactions, indicates their attractive value proposition to real estate professionals. One of eXp’s best comparables is the California based ZipRealty, Inc., which was acquired by Realogy for $167 million in August 2014. Founded in 1999, ZipRealty is a real estate brokerage with agents nationwide selling real estate on ZipRealty.com. According to Realogy, they valued ZipRealty’s brokerage business at $100 - $120 million, the technology platform at $25 - $45 million, and the remainder on other assets. Prior to the acquisition, in 2013, ZipRealty’s brokerage business had 1,800 agents with $2.7 billion in annual transactions, generating $76 million in revenues and $32 million in gross profits. The acquisition price reflects a valuation of $55k - $65k per agent, and 1.3x – 1.6x revenues. eXp management indicated to us that they believe they will be able to grow at a much faster pace compared to ZipRealty (14 years to attract 1,800 agents) as ZipRealty’s business model was more geared towards attracting consumers instead of agents. Seattle based Redfin, founded in 2004, is a firm offering real estate brokerage and database services. Redfin charges a lower commission to buyers and sellers versus other brokerages. The main difference is that rather than having agents who work on commission, Redfin hires them and pays them a salary. The company has raised approximately $165 million in capital through various venture capital funds. Sources indicate that Redfin has closed over $20 billion in sales, and currently generates well over $100 million in annual revenues. Founded in 2013, Compass (formerly Urban Compass) is a real estate listing app for iOS and Android used for renting and buying. In 2015, this company raised $50 million (bringing the total raised since inception to approximately $125 million), and sources indicate the company is currently valued at $800 million. They are estimated to have over 350 agents at this time, with more than half of them located in New York. eXp’s long-term strategy is to derive additional revenues from ancillary services related to real estate transactions. In July 2015, the company formed First Cloud Mortgage, Inc. (“First Cloud”), to originate and provide loan products and service to borrowers. eXp owns a 90.5% interest in this entity, the remaining interest is held by Tim Mulvehill, President of First Cloud Mortgage.
- 16. Page 16 2016 Fundamental Research Corp. “10+ Years of Bringing Undiscovered Investment Opportunities to the Forefront” www.researchfrc.com PLEASE READ THE IMPORTANT DISCLOSURES AT THE BACK OF THIS REPORT Management First Cloud operates as a mortgage broker and does not lend its own funds. As of March 2016, First Cloud Mortgage is licensed to conduct business in California, Arizona, New Mexico, and Texas. The company also has applications to do business pending in Virginia and Georgia. Management estimates First Cloud to broker $50 million to $75 million in loans in the next 12 months, and over $100 million in 2017. First Cloud is expected to generate gross profits of 1.5% - 3.0% of the transactions. eXp currently has 30 full-time employees and approximately 36 part-time employees / managing brokers. Glenn Sanford owns 21.31 million shares, or 42% of the total outstanding shares. Penny Sanford, former spouse of Glenn Sanford, owns an additional 16 million shares. The high equity ownership, we believe, is a very encouraging sign as it indicates management’s strong conviction in the company’s prospects, and aligns management and investors’ interests. Common Shares Options Glenn Sanford 21,311,269 1,617,000 Penny Sanford 16,006,475 Jason Gesing 286,914 1,674,131 Darren Jacklin 100,669 Total 37,705,327 3,291,131 % of Total Shares Outstanding 74.5% Brief biographies of the management team, as provided by the company, follows: Glenn Sanford, Founder & CEO Since early 2002, Glenn Sanford has been actively involved in the online real estate space. In early 2007, Mr. Sanford launched BuyerTours Realty, LLC which, using a combination of web and traditional bricks and mortar, grew to three offices and into two states. After the drop off of the market in late 2008, Mr. Sanford and his executive team went back and rewrote the entire business model in recognition of the “perfect storm” of lower revenues, fixed or rising overhead costs, and a consumer with more information and access than ever before. eXp Realty, LLC was launched in October 2009 as the first truly cloud-based national real estate brokerage. From 2005 to 2007, Mr. Sanford ran a large mega-agent team and consulted to Keller Williams International as a member of the Agent Technology Council in the areas of online client acquisition, client conversion and technology. Mr. Sanford was also a significant contributor to Keller Williams Internet Lead Generation Masterminds. Prior to real estate, Mr. Sanford was active at the executive level with a number of technology-related companies. In 1998, Mr. Sanford founded and served as President for eShippers.com, an online e-commerce and logistics company. Jason Gesing, President
- 17. Page 17 2016 Fundamental Research Corp. “10+ Years of Bringing Undiscovered Investment Opportunities to the Forefront” www.researchfrc.com PLEASE READ THE IMPORTANT DISCLOSURES AT THE BACK OF THIS REPORT Board of Directors Jason Gesing became President of eXp Realty International Corporation in September, 2013. As President of eXp Realty, the Agent-Owned Real Estate Cloud Brokerage, now operational in 30 US States and parts of Canada, Jason Gesing is actively engaged in driving company growth while working with the rest of the eXp executive team to ensure that systems, processes and infrastructure exist to support expansion. Jason participates regularly in business model profitability discussions with owners of leading independent brokerages and others demonstrating the company’s high-engagement, cloud-based model and its dramatic impact on cost, profitability and the synergies that exist when the agents and brokers of a publicly-traded real estate brokerage are also its shareholders. Alan Goldman, Chief Financial Officer (CFO) Alan Goldman joined eXp Realty International Corporation as its Chief Financial Officer on March 16, 2016. Prior to eXp, Mr. Goldman most recently served as a partner at Ingenium Accounting Associates, a PCAOB registered firm, for approximately three years. There, he was responsible for both attest and non-attest engagements primarily with public issuers, many of whom are in the real estate industry. Prior to Ingenium, Mr. Goldman worked as an auditor in another PCAOB registered firm for approximately two years. Prior to that, Mr. Goldman served as the Controller for Pacific West Companies, a vertically integrated multi-family developer. During his tenure of four years with Pacific West, the group was recognized as a top condominium developer in the country three years running. Mr. Goldman earned a Bachelor of Business Administration, with an emphasis in Finance, from the University of Georgia. He is also licensed as a Certified Public Accountant in the state of Nevada and is a member of the American Institute of Certified Public Accountants. Peter Nobel, Chief Financial Officer (COO) Peter Nobel joined the Company as its Chief Operating Officer on March 16, 2016. Prior to joining eXp, Dr. Nobel held various management positions in user research, program management, and data science at Microsoft Corporation for approximately 19 years. In this capacity, Dr. Nobel has consistently and effectively managed teams whose aim has been measuring and improving user experience, identifying gaps, and arriving at elegant solutions. The work ranged from the User Interface of online financial web sites, to qualitative and quantitative feedback tools in the Windows and Office divisions. He managed various Scrum teams that designed and created analysis and reporting tools, dashboards to track metrics and KPIs, as well as analyzed Big Data sets to understand the levers of the Net Promoter Score. Dr. Nobel received a Master’s of Science (Highest Distinction) in 1989 from Tilburg University, the Netherlands, and a Doctor of Philosophy in Cognitive Science in 1996 from Indiana University. The company’s board of directors consists of three members, including one independent member: Glenn Sanford Jason Gesing
- 18. Page 18 2016 Fundamental Research Corp. “10+ Years of Bringing Undiscovered Investment Opportunities to the Forefront” www.researchfrc.com PLEASE READ THE IMPORTANT DISCLOSURES AT THE BACK OF THIS REPORT Financials Darren Jacklin For over 19 years, Darren Jacklin has traveled four continents and over 40 countries mentoring entrepreneurs and business owners on specific and measurable strategies that they can consistently use to increase their income, transform their obstacles into cash flow and turn their passion into profits. His uncanny ability to increase wealth and success by uncovering hidden assets, overlooked opportunities and undervalued possibilities has captured the attention of Tiger 21, The Wall Street Journal, Yahoo Finance, NBC TV, CBS TV, Global TV international radio stations, magazines and newspapers, movie producers, best-selling authors, CEO’s and business experts worldwide. Darren Jacklin currently sits on paid international boards of directors of public companies and advisory boards. Darren has personally trained over 150 Fortune 500 companies such as Microsoft, AT&T, Black & Decker, Barclays Bank, as well as high school, college, university students and professional athletes and has connected with people in more than 126 countries. The following chart shows a summary of the company’s operating performance, along with our forecasts: Revenues grew at a CAGR (compounded annual growth rate) of 53% from $4.20 million in 2011, to $22.87 million in 2015. Gross profits grew at 44% from $0.79 million in 2011, to $3.41 million in 2015. Approximately 94% of the revenues in 2015 came from the U.S. (97% in 2014). The following table shows our revenue forecasts based on the company achieving 10,000 members by the end of 2020.
- 19. Page 19 2016 Fundamental Research Corp. “10+ Years of Bringing Undiscovered Investment Opportunities to the Forefront” www.researchfrc.com PLEASE READ THE IMPORTANT DISCLOSURES AT THE BACK OF THIS REPORT 2016E 2017E 2018E 2019E 2020E # of Agents (year-end) 1,800 3,000 5,000 7,250 10,000 Average Sales per Year / Agent 1,000,000 1,000,000 1,000,000 1,000,000 1,000,000 Total Transactions in the Year $1,350,000,000 $2,400,000,000 $4,000,000,000 $6,125,000,000 $8,625,000,000 Average Commission 3% 3% 3% 3% 3% Commission Revenues $40,500,000 $72,000,000 $120,000,000 $183,750,000 $258,750,000 Our revenue forecasts for FY2016, and FY2017, are $41 million and $72 million, respectively. Note that our models do not account for any revenues from First Cloud for conservatism. As First Cloud is in a start-up phase, we will incorporate our forecasts once the entity demonstrates its potential to consistently generate business over the long-term. Cost of revenues includes costs related to sales agent commissions and revenue sharing. Gross margins dropped from 18.7% in 2011, to 14.9% in 2015, primarily due to an increase in the percentage of agents being capped at 100% during a year, and the residual revenue earned by agents. Our discussions with management indicated that they expect gross margins to be in the 10% - 15% over the long-term. Margins 2011 2012 2013 2014 2015 Gross 18.7% 15.6% 16.8% 17.0% 14.9% EBITDA 0.6% -1.0% -10.4% 0.4% -19.6% EBIT 0.4% -1.1% -10.5% 0.3% -19.7% Net 0.3% -1.1% -10.5% 0.8% -20.0% General and administrative (“G&A”) expenses were 11% of revenues. Total operating expenses excluding stock based compensation were $3.09 million in 2015 (13.5% of revenues) versus $1.99 million in 2014 (14.9% of revenues). Expense as a % of Revenues 2011 2012 2013 2014 2015 General and administrative 15.0% 12.2% 12.0% 12.2% 10.7% Stock based compensation 0.0% 0.0% 10.7% 1.7% 20.9% Professional fees 1.6% 2.8% 4.0% 2.1% 1.9% Sales and marketing 1.6% 1.5% 0.6% 0.6% 0.9% Total 18.2% 16.6% 27.2% 16.6% 34.5% The company reported stock based compensation expenses of $4.79 million in 2015 (20.9% of revenues), up from $0.23 million in 2014 (1.7% of revenues). As a result, EBITDA dropped significantly in 2015, to -$4.47 million, down from $0.05 million in 2014. Excluding stock based compensation, EBITDA would have been $0.32 million. eXp reported a net loss of $4.58 million (EPS: -$0.09) in 2015, versus net profit of $0.10 million (EPS: $0.00) in 2014. Excluding stock based compensation in 2015, the company would have reported net profit of $0.21 million (EPS: $0.00).
- 20. Page 20 2016 Fundamental Research Corp. “10+ Years of Bringing Undiscovered Investment Opportunities to the Forefront” www.researchfrc.com PLEASE READ THE IMPORTANT DISCLOSURES AT THE BACK OF THIS REPORT Cash Flows Our base-case forecasts are shown below: STATEMENTS OF OPERATIONS (in US$) - YEDec 31st 2016E 2017E 2018E 2019E 2020E Net Revenues 40,500,000 72,000,000 120,000,000 183,750,000 258,750,000 COGS 34,425,000 61,920,000 104,400,000 160,781,250 226,406,250 Gross Profit 6,075,000 10,080,000 15,600,000 22,968,750 32,343,750 EXPENSES General and administrative 2,835,000 4,320,000 6,000,000 7,350,000 7,762,500 Stock based compensation 1,215,000 2,160,000 3,600,000 5,512,500 7,762,500 Professional fees 483,739 532,113 585,325 643,857 708,243 Sales and marketing 416,623 1,440,000 2,400,000 3,675,000 5,175,000 EBITDA 1,124,638 1,627,887 3,014,675 5,787,393 10,935,507 Amortization 22,039 47,631 78,105 112,484 139,987 EBIT 1,102,599 1,580,256 2,936,570 5,674,909 10,795,520 Other income - - - - - Interest expense EBT 1,102,599 1,580,256 2,936,570 5,674,909 10,795,520 Taxes 385,910 553,089 1,027,800 1,986,218 3,778,432 Net Profit (Loss) 716,689 1,027,166 1,908,771 3,688,691 7,017,088 EPS 0.01 0.02 0.04 0.07 0.14 Margins 2016E 2017E 2018E 2019E 2020E Gross 15.0% 14.0% 13.0% 12.5% 12.5% EBITDA 2.8% 2.3% 2.5% 3.1% 4.2% EBIT 2.7% 2.2% 2.4% 3.1% 4.2% Net 1.8% 1.4% 1.6% 2.0% 2.7% Our net profit forecast for 2016 is $0.72 million (EPS: $0.01) and for 2017 is $1.03 million (EPS: $0.03). The following table shows a summary of the company’s cash flows, along with our forecasts. Summary of Cash Flows (US$, mm) 2011 2012 2013 2014 2015 2016E 2017E 2018E 2019E 2020E Operating -$0.02 -$0.00 $0.02 $0.24 $0.35 $2.08 $3.53 $6.05 $9.93 $15.63 Investing -$0.01 -$0.00 -$0.04 -$0.05 -$0.06 -$0.15 -$0.20 -$0.25 -$0.25 -$0.25 Financing $0.04 -$0.01 $0.07 $0.06 -$0.06 $0.00 $0.00 $0.00 $0.00 $0.00 Effects of Exchange Rate $0.00 $0.00 $0.00 -$0.00 -$0.01 $0.00 $0.00 $0.00 $0.00 $0.00 Net $0.00 -$0.01 $0.04 $0.25 $0.22 $1.93 $3.33 $5.80 $9.68 $15.38 Free Cash Flows to Firm (FCF) -$0.03 -$0.00 -$0.02 $0.20 $0.29 $1.93 $3.33 $5.80 $9.68 $15.38 Free cash flows (“FCF”) have been positive in the past two years and were $0.29 million in 2015 versus $0.20 million in 2014.
- 21. Page 21 2016 Fundamental Research Corp. “10+ Years of Bringing Undiscovered Investment Opportunities to the Forefront” www.researchfrc.com PLEASE READ THE IMPORTANT DISCLOSURES AT THE BACK OF THIS REPORT Balance Sheet Stock Options and Warrants Valuation and Rating The company maintains a healthy balance sheet with no debt. At the end of 2015, the company had $0.57 million in cash. Working capital and the current ratio were $0.48 million and 1.7x, respectively. The following table shows the company’s cash and liquidity position. Liquidity & Capital Structure 2011 2012 2013 2014 2015 (US$) Cash 73,209 58,308 100,056 353,374 571,814 Working Capital 29,669 (149,187) 35,850 259,077 482,311 Current Ratio 1.2 0.6 1.1 1.5 1.7 LT Debt 65,862 61,887 61,887 - - Total Debt 65,862 179,305 80,119 61,887 - LT Debt / Capital 143.9% -281.5% 62.6% 0.0% 0.0% Total Debt / Capital 143.9% -815.6% 81.0% 13.0% 0.0% EBIT Interest Coverage (excl. stock comp) 8.8 (37.7) 10.5 282.9 258.9 Accounts Receivables (days) 3.1 2.9 3.1 4.1 4.2 Accounts Payable (days) 2.1 2.3 2.2 2.2 1.6 Cash Cycle 1.0 0.6 0.9 1.8 2.6 eXp currently has 7.28 million options (weighted average exercise price – $0.16), and no warrants outstanding. All the options are currently in the money. The company can raise up to $1.16 million if all these options are exercised. As eXp does not have a direct comparable, we decided not to use a comparables valuation approach to estimate the fair value of eXp’s shares. The following table shows our Discounted Cash Flow (“DCF”) model based on our base-case forecasts presented earlier in the report, which assigns a fair value estimate of $3.35 per share on eXp’s shares. DCF Valuation (US$) 2016E 2017E 2018E 2019E 2020E Terminal Funds Flow fromOperations $1,953,728 $3,234,797 $5,586,876 $9,313,675 $14,919,575 -increase in w/c $126,041 $298,252 $466,637 $618,971 $713,476 Cash Flows fromOperations $2,079,769 $3,533,049 $6,053,513 $9,932,645 $15,633,051 -capex -$150,000 -$200,000 -$250,000 -$250,000 -$250,000 Free Cash Flows $1,929,769 $3,333,049 $5,803,513 $9,682,645 $15,383,051 $260,640,441 Present Value $1,794,193 $2,812,056 $4,443,156 $6,726,870 $9,697,950 $164,315,763 Discount Rate 10.2% Terminal Growth 3% Present Value $189,789,988 Cash - Debt $720,427 Fair Value $190,510,415 Shares O/S (treasury stock method) 56,900,327 Value per share (US$) $3.35 We used a discount rate of 10.2%, which we estimate is in line with the average of the Real Estate Service industry and the Brokerage industry.
- 22. Page 22 2016 Fundamental Research Corp. “10+ Years of Bringing Undiscovered Investment Opportunities to the Forefront” www.researchfrc.com PLEASE READ THE IMPORTANT DISCLOSURES AT THE BACK OF THIS REPORT Risks The following chart shows the sensitivity of our fair value estimate to the expected number of members by the end of 2020. As shown in the chart, the valuation increases to $8.44 per share if our models assume 25,000 members by the end of 2020. The valuation drops to $0.79 per share if our models assume only 2,500 members by the end of 2020. As a result of our analysis, we are initiating coverage on eXp with a BUY rating and a fair value estimate of $3.35 per share. We expect several catalysts for the shares over the next 12 months as the company continues to grow its membership base. We expect the company to report significant YOY revenue and EPS growth in every quarter this year. The following risks may cause our estimates to differ from actual results (not exhaustive): The real estate brokerage industry is highly competitive. The company’s ability to adapt to technological advancements will play a vital role in its long-term success. The company’s profitability is highly dependent on the overall health of the real estate market. eXp is in a growth phase and has a relatively short track record. Long-term retention of agents has yet to be proven. As with any real estate brokerage, the company is also susceptible to negative changes to the regulatory laws. Critical technologies are currently licensed from third-parties. The company is evaluating insourcing options to alleviate any future risks.
- 23. Page 23 2016 Fundamental Research Corp. “10+ Years of Bringing Undiscovered Investment Opportunities to the Forefront” www.researchfrc.com PLEASE READ THE IMPORTANT DISCLOSURES AT THE BACK OF THIS REPORT Appendix STATEMENTS OF OPERATIONS (in US$) - YEDec 31st 2011 2012 2013 2014 2015 2016E 2017E Net Revenues 4,199,617 6,706,145 10,701,280 13,368,905 22,866,787 40,500,000 72,000,000 COGS 3,412,638 5,657,067 8,905,114 11,099,750 19,456,409 34,425,000 61,920,000 Gross Profit 786,979 1,049,078 1,796,166 2,269,155 3,410,378 6,075,000 10,080,000 EXPENSES General and administrative 630,083 820,639 1,285,859 1,635,555 2,441,089 2,835,000 4,320,000 Stock based compensation 874 1,139,915 233,098 4,790,568 1,215,000 2,160,000 Professional fees 67,288 190,912 424,361 276,558 439,763 483,739 532,113 Sales and marketing 65,625 102,267 60,197 76,019 211,456 416,623 1,440,000 EBITDA 23,109 (64,740) (1,114,166) 47,925 (4,472,498) 1,124,638 1,627,887 Amortization 5,472 6,710 4,442 14,493 26,304 22,039 47,631 EBIT 17,637 (71,450) (1,118,608) 33,432 (4,498,802) 1,102,599 1,580,256 Other income 3,324 0 23 - - Interest expense -2,108 -1,895 -2,034 -942 -1,127 EBT 15,529 (73,345) (1,117,318) 32,490 (4,499,906) 1,102,599 1,580,256 Taxes 2,033 2,147 1,543 -71,353 103,069 385,910 553,089 Net Profit (Loss) 13,496 (75,492) (1,118,861) 103,843 (4,602,975) 716,689 1,027,166 EPS 0.00 -0.00 -0.00 0.00 -0.09 0.01 0.02 Non-controlling interests 21,526 - - Net Profit (Loss) to common shareholders 13,496 -75,492 -1,118,861 103,843 -4,581,449 716,689 1,027,166 EPS 0.00 -0.00 -0.00 0.00 -0.09 0.01 0.02
- 24. Page 24 2016 Fundamental Research Corp. “10+ Years of Bringing Undiscovered Investment Opportunities to the Forefront” www.researchfrc.com PLEASE READ THE IMPORTANT DISCLOSURES AT THE BACK OF THIS REPORT BALANCESHEETS (in US$) - YEDec 31st 2011 2012 2013 2014 2015 2016E 2017E ASSETS CURRENT Cash and cash equiv. 73,209 58,308 100,056 353,374 571,814 2,501,583 5,834,632 Restricted cash 26,759 61,687 38,198 141,508 148,613 148,613 148,613 A/R 35,556 71,449 107,840 189,026 341,643 469,941 835,451 Prepaid 21,295 16,545 39,793 74,673 84,451 140,914 250,515 Total Current Assets 156,819 207,989 285,887 758,581 1,146,521 3,261,052 7,069,211 Fixed assets 16,106 9,784 44,854 79,393 110,195 238,156 390,525 Deferred taxassets 75,196 Total Assets 172,925 217,773 330,741 913,170 1,256,716 3,499,208 7,459,736 LIABILITIES CURRENT A/P 19,923 51,335 55,826 79,389 89,984 149,839 269,515 Customer deposits 26,759 61,687 38,198 141,508 148,613 256,921 456,748 Accrued expenses / interest 80,468 126,736 137,781 216,720 425,613 568,253 1,022,112 Notes payable 15,000 61,887 Due to related party 102,418 18,232 Total Current Liabilities 127,150 357,176 250,037 499,504 664,210 975,013 1,748,375 Notes payable 65,862 61,887 61,887 SHAREHOLDERS EQUITY Share capital 156,831 193,331 1,532,299 1,824,847 6,612,283 6,612,283 6,612,283 Accumulated deficit / comprehensive loss -176,918 -394,621 -1,513,482 -1,411,181 -6,000,201 -4,068,512 -881,346 Non-controlling interests -19,576 -19,576 -19,576 Total shareholders’ equity (deficiency) (20,087) (201,290) 18,817 413,666 592,506 2,524,195 5,711,361 Total Liabilities andShareholders Equity 172,925 217,773 330,741 913,170 1,256,716 3,499,208 7,459,736
- 25. Page 25 2016 Fundamental Research Corp. “10+ Years of Bringing Undiscovered Investment Opportunities to the Forefront” www.researchfrc.com PLEASE READ THE IMPORTANT DISCLOSURES AT THE BACK OF THIS REPORT STATEMENTS OF CASHFLOWS (in US$) - YEDec 31st 2011 2012 2013 2014 2015 2016E 2017E OPERATINGACTIVITIES Net profit for the year 13,496 -75,492 -1,118,861 103,843 -4,602,975 716,689 1,027,166 Adjustedfor items not involving cash: Depreciation 5,472 6,710 4,442 14,493 26,304 22,039 47,631 Stock compensation / option expense 874 1,139,915 233,098 4,790,568 1,215,000 2,160,000 Deferred taxasset 2,108 -75,196 75,196 Funds From Operations 21,950 -68,782 25,496 276,238 289,093 1,953,728 3,234,797 Change in working capital A/R -8,966 -35,893 -36,391 -81,186 -152,617 -128,298 -365,510 Prepaid -19,934 5,350 -23,248 -34,880 -9,778 -56,463 -109,600 A/P -16,585 30,169 4,491 23,563 10,595 59,855 119,675 Accrurent expenses 2,675 33,146 11,045 78,939 208,893 250,947 653,687 Due to related parties 35,472 34,633 -18,232 NET CASHUSED IN OPERATINGACTIVITIES -20,860 -538 16,026 244,442 346,186 2,079,769 3,533,049 INVESTINGACTIVITIES PP&E -13,028 -387 -39,513 -49,032 -57,116 -150,000 -200,000 NET CASHUSED IN INVESTINGACTIVITIES -13,028 -387 -39,513 -49,032 -57,116 -150,000 -200,000 FINANCINGACTIVITIES Equity 41,126 80,235 59,450 -1,182 Debt -5,638 -13,976 -15,000 -61,877 NET CASHFROMFINANCINGACTIVITIES 35,488 -13,976 65,235 59,450 -63,059 0 0 Foreign Exchange / Others -1,542 -7,571 INCREASEIN CASHFOR THEYEAR 1,600 -14,901 41,748 253,318 218,440 1,929,769 3,333,049 CASH, BEGINNINGOF THE YEAR 71,609 73,209 58,308 100,056 353,374 571,814 2,501,583 CASH, END OF THEYEAR 73,209 58,308 100,056 353,374 571,814 2,501,583 5,834,632
- 26. Page 26 2016 Fundamental Research Corp. “10+ Years of Bringing Undiscovered Investment Opportunities to the Forefront” www.researchfrc.com PLEASE READ THE IMPORTANT DISCLOSURES AT THE BACK OF THIS REPORT Fundamental Research Corp. Equity Rating Scale: Buy – Annual expected rate of return exceeds 12% or the expected return is commensurate with risk Hold – Annual expected rate of return is between 5% and 12% Sell – Annual expected rate of return is below 5% or the expected return is not commensurate with risk Suspended or Rating N/A— Coverage and ratings suspended until more information can be obtained from the company regarding recent events. Fundamental Research Corp. Risk Rating Scale: 1 (Low Risk) - The company operates in an industry where it has a strong position (for example a monopoly, high market share etc.) or operates in a regulated industry. The future outlook is stable or positive for the industry. The company generates positive free cash flow and has a history of profitability. The capital structure is conservative with little or no debt. 2 (Below Average Risk) - The company operates in an industry where the fundamentals and outlook are positive. The industry and company are relatively less sensitive to systematic risk than companies with a Risk Rating of 3. The company has a history of profitability and has demonstrated its ability to generate positive free cash flows (though current free cash flow may be negative due to capital investment). The company’s capital structure is conservative with little to modest use of debt. 3 (Average Risk) - The company operates in an industry that has average sensitivity to systematic risk. The industry may be cyclical. Profits and cash flow are sensitive to economic factors although the company has demonstrated its ability to generate positive earnings and cash flow. Debt use is in line with industry averages, and coverage ratios are sufficient. 4 (Speculative) - The company has little or no history of generating earnings or cash flow. Debt use is higher. These companies may be in start-up mode or in a turnaround situation. These companies should be considered speculative. 5 (Highly Speculative) - The company has no history of generating earnings or cash flow. They may operate in a new industry with new, and unproven products. Products may be at the development stage, testing, or seeking regulatory approval. These companies may run into liquidity issues, and may rely on external funding. These stocks are considered highly speculative. Disclaimers and Disclosure The opinions expressed in this report are the true opinions of the analyst about this company and industry. Any “forward looking statements” are our best estimates and opinions based upon information that is publicly available and that we believe to be correct, but we have not independently verified with respect to truth or correctness. There is no guarantee that our forecasts will materialize. Actual results will likely vary. The analyst and Fundamental Research Corp. “FRC” does not own any shares of the subject company, does not make a market or offer shares for sale of the subject company, and does not have any investment banking business with the subject company. Fees were paid by eXp to FRC. The purpose of the fee is to subsidize the high costs of research and monitoring. FRC takes steps to ensure independence including setting fees in advance and utilizing analysts who must abide by CFA Institute Code of Ethics and Standards of Professional Conduct. Additionally, analysts may not trade in any security under coverage. Our full editorial control of all research, timing of release of the reports, and release of liability for negative reports are protected contractually. To further ensure independence, eXp has agreed to a minimum coverage term including four updates. Coverage can not be unilaterally terminated. Distribution procedure: our reports are distributed first to our web-based subscribers on the date shown on this report then made available to delayed access users through various other channels for a limited time. The distribution of FRC’s ratings are as follows: BUY (69%), HOLD (8%), SELL (5%), SUSPEND (18%). To subscribe for real-time access to research, visit http://www.researchfrc.com/subscription.htm for subscription options. This report contains "forward looking" statements. Forward-looking statements regarding the Company and/or stock’s performance inherently involve risks and uncertainties that could cause actual results to differ from such forward-looking statements. Factors that would cause or contribute to such differences include, but are not limited to, continued acceptance of the Company's products/services in the marketplace; acceptance in the marketplace of the Company's new product lines/services; competitive factors; new product/service introductions by others; technological changes; dependence on suppliers; systematic market risks and other risks discussed in the Company's periodic report filings, including interim reports, annual reports, and annual information forms filed with the various securities regulators. By making these forward looking statements, Fundamental Research Corp. and the analyst/author of this report undertakes no obligation to update these statements for revisions or changes after the date of this report. A report initiating coverage will most often be updated quarterly while a report issuing a rating may have no further or less frequent updates because the subject company is likely to be in earlier stages where nothing material may occur quarter to quarter. Fundamental Research Corp DOES NOT MAKE ANY WARRANTIES, EXPRESSED OR IMPLIED, AS TO RESULTS TO BE OBTAINED FROM USING THIS INFORMATION AND MAKES NO EXPRESS OR IMPLIED WARRANTIES OR FITNESS FOR A PARTICULAR USE. ANYONE USING THIS REPORT ASSUMES FULL RESPONSIBILITY FOR WHATEVER RESULTS THEY OBTAIN FROM WHATEVER USE THE INFORMATION WAS PUT TO. ALWAYS TALK TO YOUR FINANCIAL ADVISOR BEFORE YOU INVEST. WHETHER A STOCK SHOULD BE INCLUDED IN A PORTFOLIO DEPENDS ON ONE’S RISK TOLERANCE, OBJECTIVES, SITUATION, RETURN ON OTHER ASSETS, ETC. ONLY YOUR INVESTMENT ADVISOR WHO KNOWS YOUR UNIQUE CIRCUMSTANCES CAN MAKE A PROPER RECOMMENDATION AS TO THE MERIT OF ANY PARTICULAR SECURITY FOR INCLUSION IN YOUR PORTFOLIO. This REPORT is solely for informative purposes and is not a solicitation or an offer to buy or sell any security. It is not intended as being a complete description of the company, industry, securities or developments referred to in the material. Any forecasts contained in this report were independently prepared unless otherwise stated, and HAVE NOT BEEN endorsed by the Management of the company which is the subject of this report. Additional information is available upon request. THIS REPORT IS COPYRIGHT. YOU MAY NOT REDISTRIBUTE THIS REPORT WITHOUT OUR PERMISSION. Please give proper credit, including citing Fundamental Research Corp and/or the analyst, when quoting information from this report. The information contained in this report is intended to be viewed only in jurisdictions where it may be legally viewed and is not intended for use by any person or entity in any jurisdiction where such use would be contrary to local regulations or which would require any registration requirement within such jurisdiction.