 Alberto Ferrari
UPDATE 2020-11-10: You can find a more complete detailed and optimized example for the following scenario in the DAX Patterns: Comparing different time periods article+video on daxpatterns.com.
Time intelligence calculations are among the most required functionalities in any data model. Year-to-date, same period last year, comparison of different time periods are probably the most requested features of any BI solution.
There is an interesting calculation that requires a certain level of effort in data modeling. Can I compare two custom time periods letting the user choose those periods with a slicer, both in terms of start and duration?
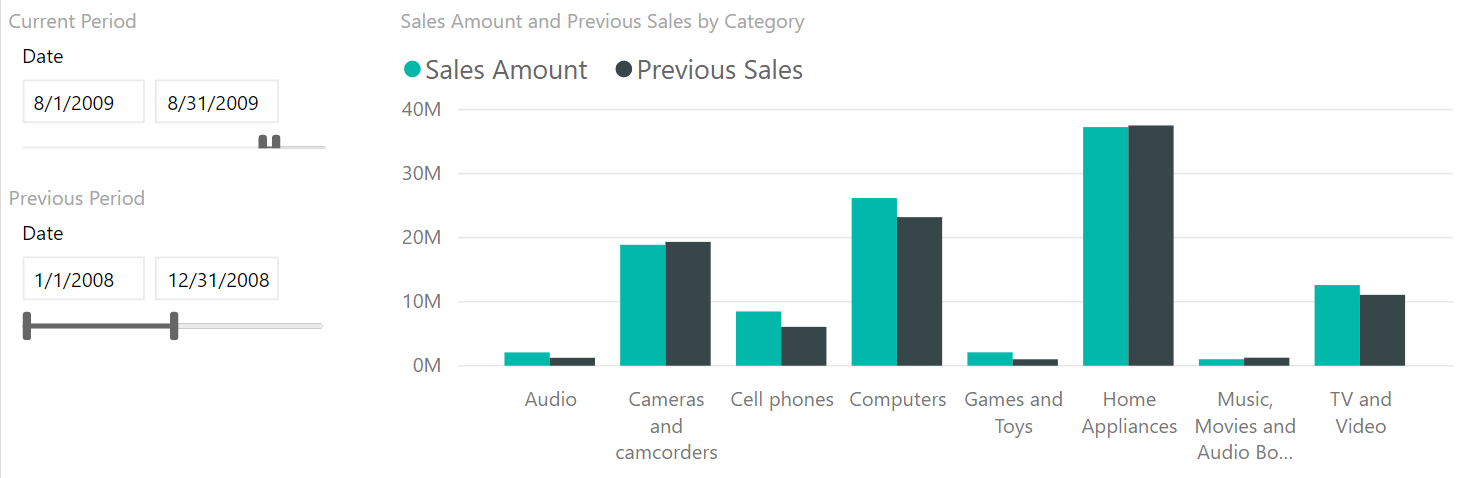
A picture is worth a thousand words. In the next report we compare August 2009 (Sales Amount) with the full year 2008 (Previous Sales). Because the two periods have a different duration, we normalized the values of 2008 using a factor that makes the two numbers comparable:
These are the steps required in order to solve the above scenario:
- Building a model where the user can choose two different periods using a slicer,
- Writing a DAX formula to compute the same value over both periods,
- Normalizing the values using a normalization factor.
The first step requires a new Date table in the model. Using calculated tables, this is as easy as creating a new calculated table that is a shallow copy of the original Date:
Previous Date = ALLNOBLANKROW ( 'Date' )
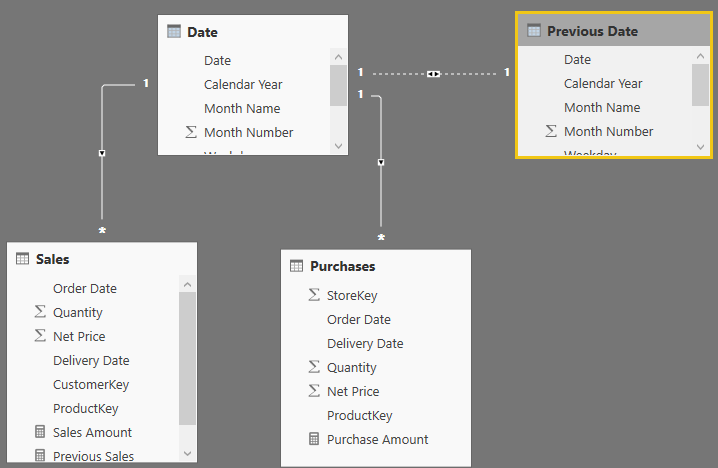
Now that you have the table, you need to setup the relationships. If there is only one fact table, you can simply build a new relationship with the proper date in the fact table. If there are multiple fact tables, then the number of inactive relationships grows and the model becomes messy. You can avoid creating multiple inactive relationships by creating only one, although it is less intuitive.
You can link Date with Previous Date through a 1:1 inactive relationship. When you compute values slicing by Date, the relationship is not going to affect your calculations. When you compute values over the previous period, you enable the relationship so that Date becomes filtered by Previous Date.
The resulting model is:
 This whole logic can be expressed in this DAX formula:
Previous Sales :=
CALCULATE (
    [Sales Amount],
    ALL ( 'Date' ),
    USERELATIONSHIP ( 'Date'[Date], 'Previous Date'[Date] )
)
You need to perform ALL on Date to get rid of any existing filter(s) on the Date table. Then, activate the relationship that will filter Date by Previous Date. The effect of these two filter arguments is to move the filter from Previous Date to Date. Because of that, all the fact tables linked to Date will be filtered according to Previous Date.
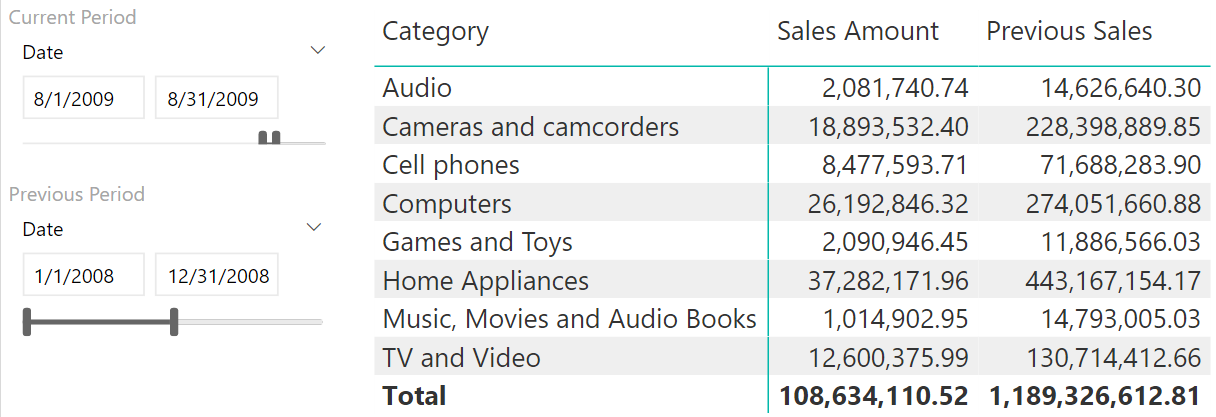
Using this measure, you can show two measures pertaining to the two selected periods within the same report. Yet, this is not perfect, because the value displayed for Previous Sales is much larger than the one displayed for Sales Amount. The reason is the disproportionate time period – not a decrease in sales. Indeed, we are considering one year for Previous Sales and only one month for Sales Amount.
You need a suitable normalization factor to normalize the values. There might be many, and this is a business decision more than a technical decision. In this example, we go for a simple normalization based on the number of days. If you divide sales by the number of days in the Previous Period selection, you obtain the average sales per day in the previous period. This value, multiplied by the number of days in the Current Period (the Date table) produces a normalized value for the previous selection:
Normalization Factor :=
DIVIDE (
    COUNTROWS ( 'Date' ),
    COUNTROWS ( 'Previous Date' )
)
The final formula for the Previous Sales measure becomes:
Previous Sales :=
CALCULATE (
     [Sales Amount],
     ALL ( 'Date' ),
     USERELATIONSHIP ( 'Date'[Date], 'Previous Date'[Date] )
) * [Normalization Factor]
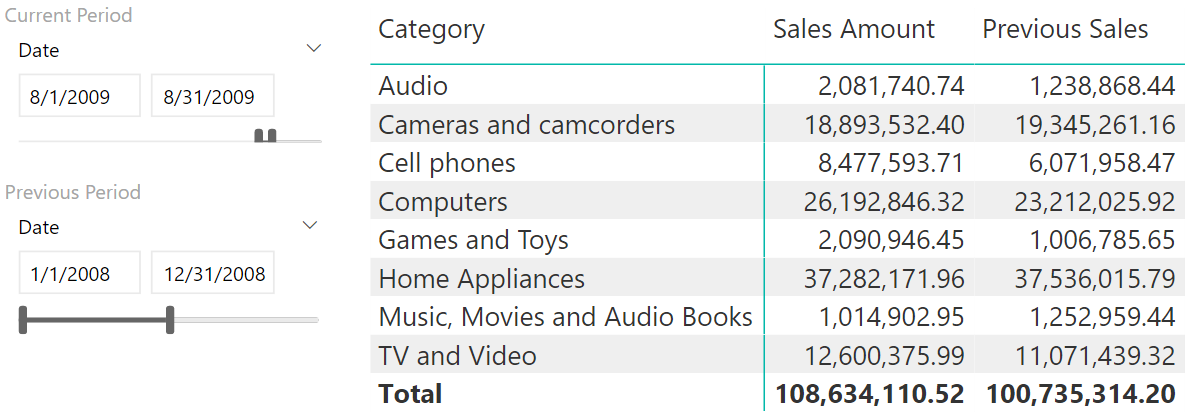
Once the normalization factor comes into play, the numbers become comparable and you can use them in a matrix or in a chart. You saw a chart example in the first figure of this article. The following example shows the result in a matrix:
Conclusion
DAX offers many time intelligence calculations, but nothing beats your imagination and the power of a custom data model with a bit of DAX code. Users love the flexibility of this calculation, which simply requires users to define a normalization factor.
Returns all the rows in a table, or all the values in a column, ignoring any filters that might have been applied.
ALL ( [<TableNameOrColumnName>] [, <ColumnName> [, <ColumnName> [, … ] ] ] )