
Are You Running the Right Medical Billing Reports?
Medical billing reports are a great tool for helping you diagnose the financial health of your practice, but that doesn’t mean they’re easy to understand. Given the number of different reports available, figuring out which ones will be more effective is an important task for practices.
We’ve narrowed the list of potential reports down to the three most important for independent medical practices:
The Accounts Receivable Aging report
The Key Performance Indicators report
The Top Carrier/Insurance Analysis report
We selected these medical billing reports because they will show you how your practice is performing on important revenue cycle metrics, whether claims are being paid in a timely fashion, and and how well insurance carriers are paying you for key procedures, among other things.
Use the Accounts Receivable Aging report to track how long claims take to process
The Accounts Receivable (A/R) Aging report landed on our list because it’s such a great yardstick for measuring the overall financial health of a practice. By looking at this report, an experienced biller can tell whether or not the practice’s billing department is doing an adequate job.
While the A/R Aging report could technically be generated by hand, the amount of time it would take would make doing so impractical.
Fortunately, most medical billing software programs are equipped to produce these reports, as well as Insurance Payment Trend reports and Insurance Collection reports—two related reports that can provide a more detailed view of your A/R status.
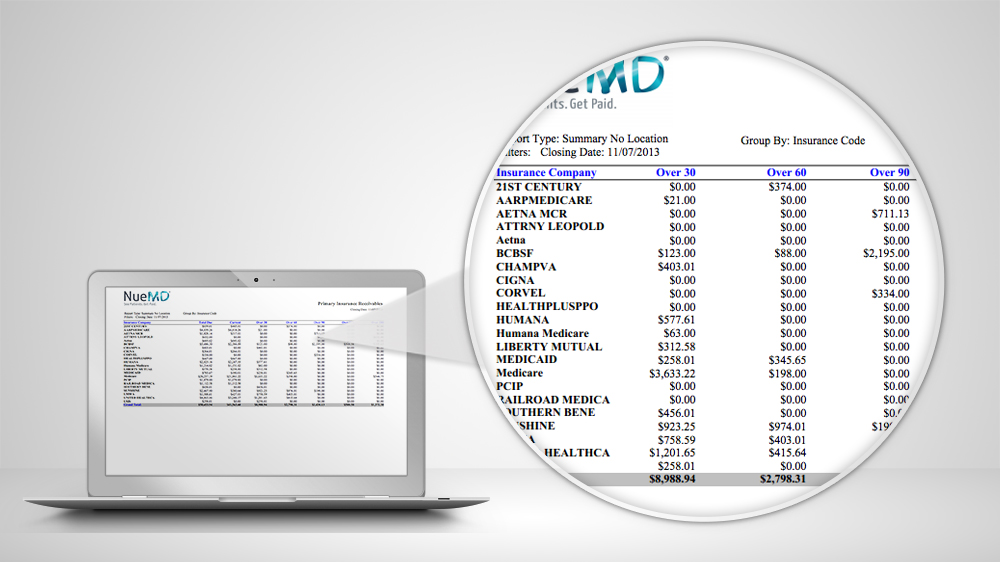


NueMD‘s Insurance Collection Report
What data does this report track?
The A/R Aging report breaks down claims based on the number of days they’ve been in receivables (in other words, the number of days they’ve been unpaid).
Most claims take an average of about a month to get paid. This report allows you to identify potential issues from a high-level view, while the follow-up reports give you a close-up look at what issues might be causing delays in payment.
Red flags: Claims that take longer than 45 days to process
In the A/R Aging report, an ideal result would be to see that all claims are being paid within 45 days.
There might be a problem if a claim hasn’t been either paid or rejected by this time—so if you’re seeing claims stuck in receivables for more than 45 days, it’s worth following up on.
Aging over 90 days is an even bigger red flag. At this point, it’s crucial for your practice to get the claim handled, as unpaid claims could interfere with insurance companies’ timely filing deadlines.
On the other hand, there’s not necessarily a need to panic if you see one or two claims taking longer to process. A lot of factors can affect this report, such as your practice’s patient population and the amount of paper and electronic claims being submitted. Likewise, claims from workers’ compensation, automobile accidents, and out-of-state insurance carriers generally take longer to process.
A high volume of paper claims can also result in longer processing times; the average paper claim takes about a month to process, while electronic claims are frequently processed in as little as two weeks.
Use the Key Performance Indicators report to spot trends in collections
The Key Performance Indicators (KPI) report is a valuable tool for identifying key areas in your practice’s RCM process where performance is critical, establishing goals for those areas, and measuring progress against those goals.
Again, many medical billing systems come with the ability to run KPI reports that are specific to the medical billing industry, which saves valuable time for independent practices and billers.
Running this report once a week on average will give you an uninterrupted view of your billing performance. It can also help identify any problems or breakdowns in the claims process as well as which services and CPT codes are the most profitable for your practice.
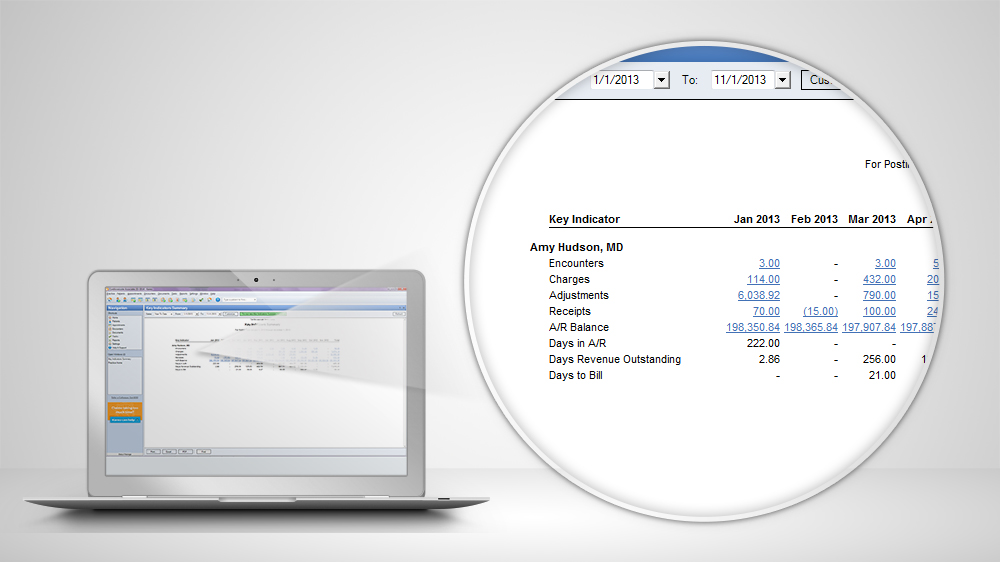

Kareo‘s Key Performance Indicators Report
What data does this report track?
KPI reports can track a variety of information, including:
Total encounters
Total number of procedures
Total charges
Total collections
Outstanding A/R
Total adjustments
This report allows billers to compare a variety of indicators from month to month and identify both positive and negative trends. This enables practices to keep doing what’s working, and change what isn’t.
Red flags: Big variations in total collections
In the Key Performance Indicators report, naturally, you want to see steady or positive trends in your top indicators.
If you have relatively steady charges, your collections should be relatively steady as well. If your charges have been increasing, your collections should too. If you’ve identified potential problem areas and have been working towards, for example, increasing overall collections, you’re looking for evidence that your work is paying off.
A red flag in the KPI report is any dramatic and unexpected change in total collections. For example, a sudden drop in collections that have historically been consistent could indicate a problem. And if charges increase one month, but collections don’t increase the following month, this might mean trouble, as well.
Use the Top Carrier/Insurance Analysis report to make sure you’re charging the right amount
The Top Carrier/Insurance Analysis Report is among the most useful for helping practices save time and money. This report also tracks revenue cycle metrics, providing practices with a snapshot of how the overall business is doing.
To run these reports, users can look to certain healthcare BI software systems or create these reports manually in Excel or sheets.
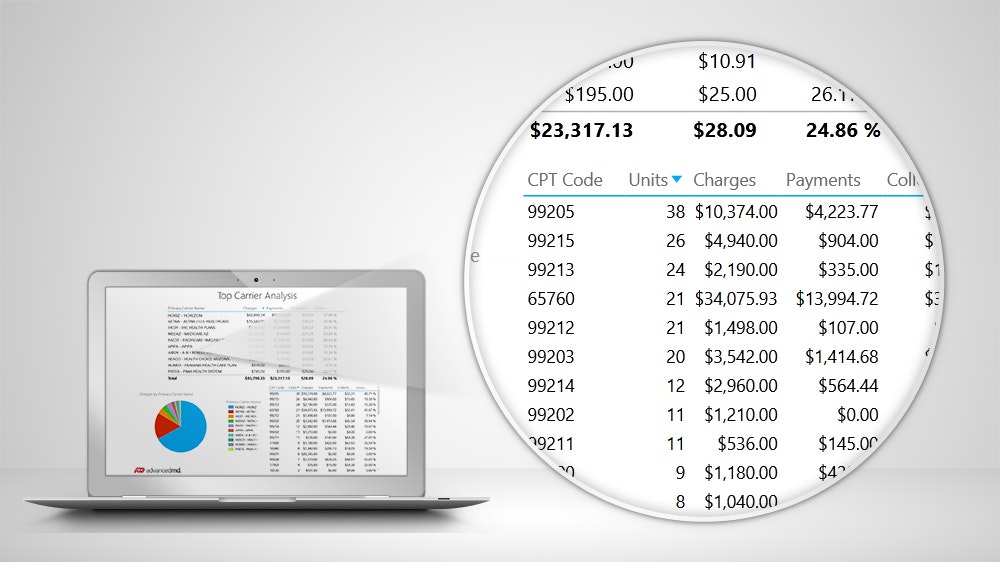

AdvancedMD‘s Top Carrier/Insurance Analysis Report
What data does this report track?
The Top Carrier/Insurance Analysis Report tracks the charges, payments and collections of your practice’s top 10 carriers—in other words, the payers and insurance companies that make up the majority of your practice’s business.
The report also tracks payments, collections, and CPT codes and units, allowing the practice to drill down into the charges, payments, and collections for a specific CPT code. This report also provides important information practices can use to negotiate better pricing with payers and insurance companies.
Most importantly, the Top Carrier/Insurance Analysis Report tracks Collection Per Total Relative Value Unit (RVU).
Physicians submit claims using CPT codes for the procedures they complete, and every CPT code has a total RVU assigned to it. This RVU helps determine how much your practice is paid for each of its services. By looking at the Collection Per Total RVU rate for given procedures, you can gauge how good your practice’s rates are, how you’re getting paid for certain procedures, and how your revenue cycle is going.
Red flags: Collections per total RVU for top carriers falls below the Medicare Conversion Factor
In the Top Carrier/Insurance Analysis Report, you’re hoping to see that all of your top commercial carriers have a Collection Per Total RVU that is higher than the current Medicare Conversion Factor (right now, this is $36.04).
Ideally, you want your top carriers to have a Collection Per Total RVU of about $40 to $50. You also want to see all of your top commercial carriers with very similar Collection Per Total RVU rates.
If the Collection Per Total RVU rates for your top carriers are lower than $36.04, you may not be collecting the right amount from your patients. It’s also a red flag if there is a wide variation in the Collection Per Total RVU rates for your top carriers. If you find that one carrier is paying you a significantly lower amount for the same procedures, you may want to consider dropping the carrier or renegotiating your contract.
Use our team of advisors to make sure you’ve selected the right medical billing software
No matter which medical billing reports you choose to run, having the right software will make tracking your performance and collecting your payments so much easier.
Still not convinced? This video breaks down the different critical medical billing error statistics from how often they occur to how much they’ll cost you.
To learn more about your medical billing, healthcare BI, or revenue cycle management software options, reach out to our team of medical advisors for a quick consultation. You’ll receive a list of providers whose products meet your specific needs, so you can take the time you would spend running reports manually and focus on more important things.