Systematic Review and Bayesian Meta-analysis of the Dose-response Relationship between Folic Acid Intake and Changes in Blood Folate Concentrations

 ,
,
Abstract
:1. Introduction
2. Materials and Methods
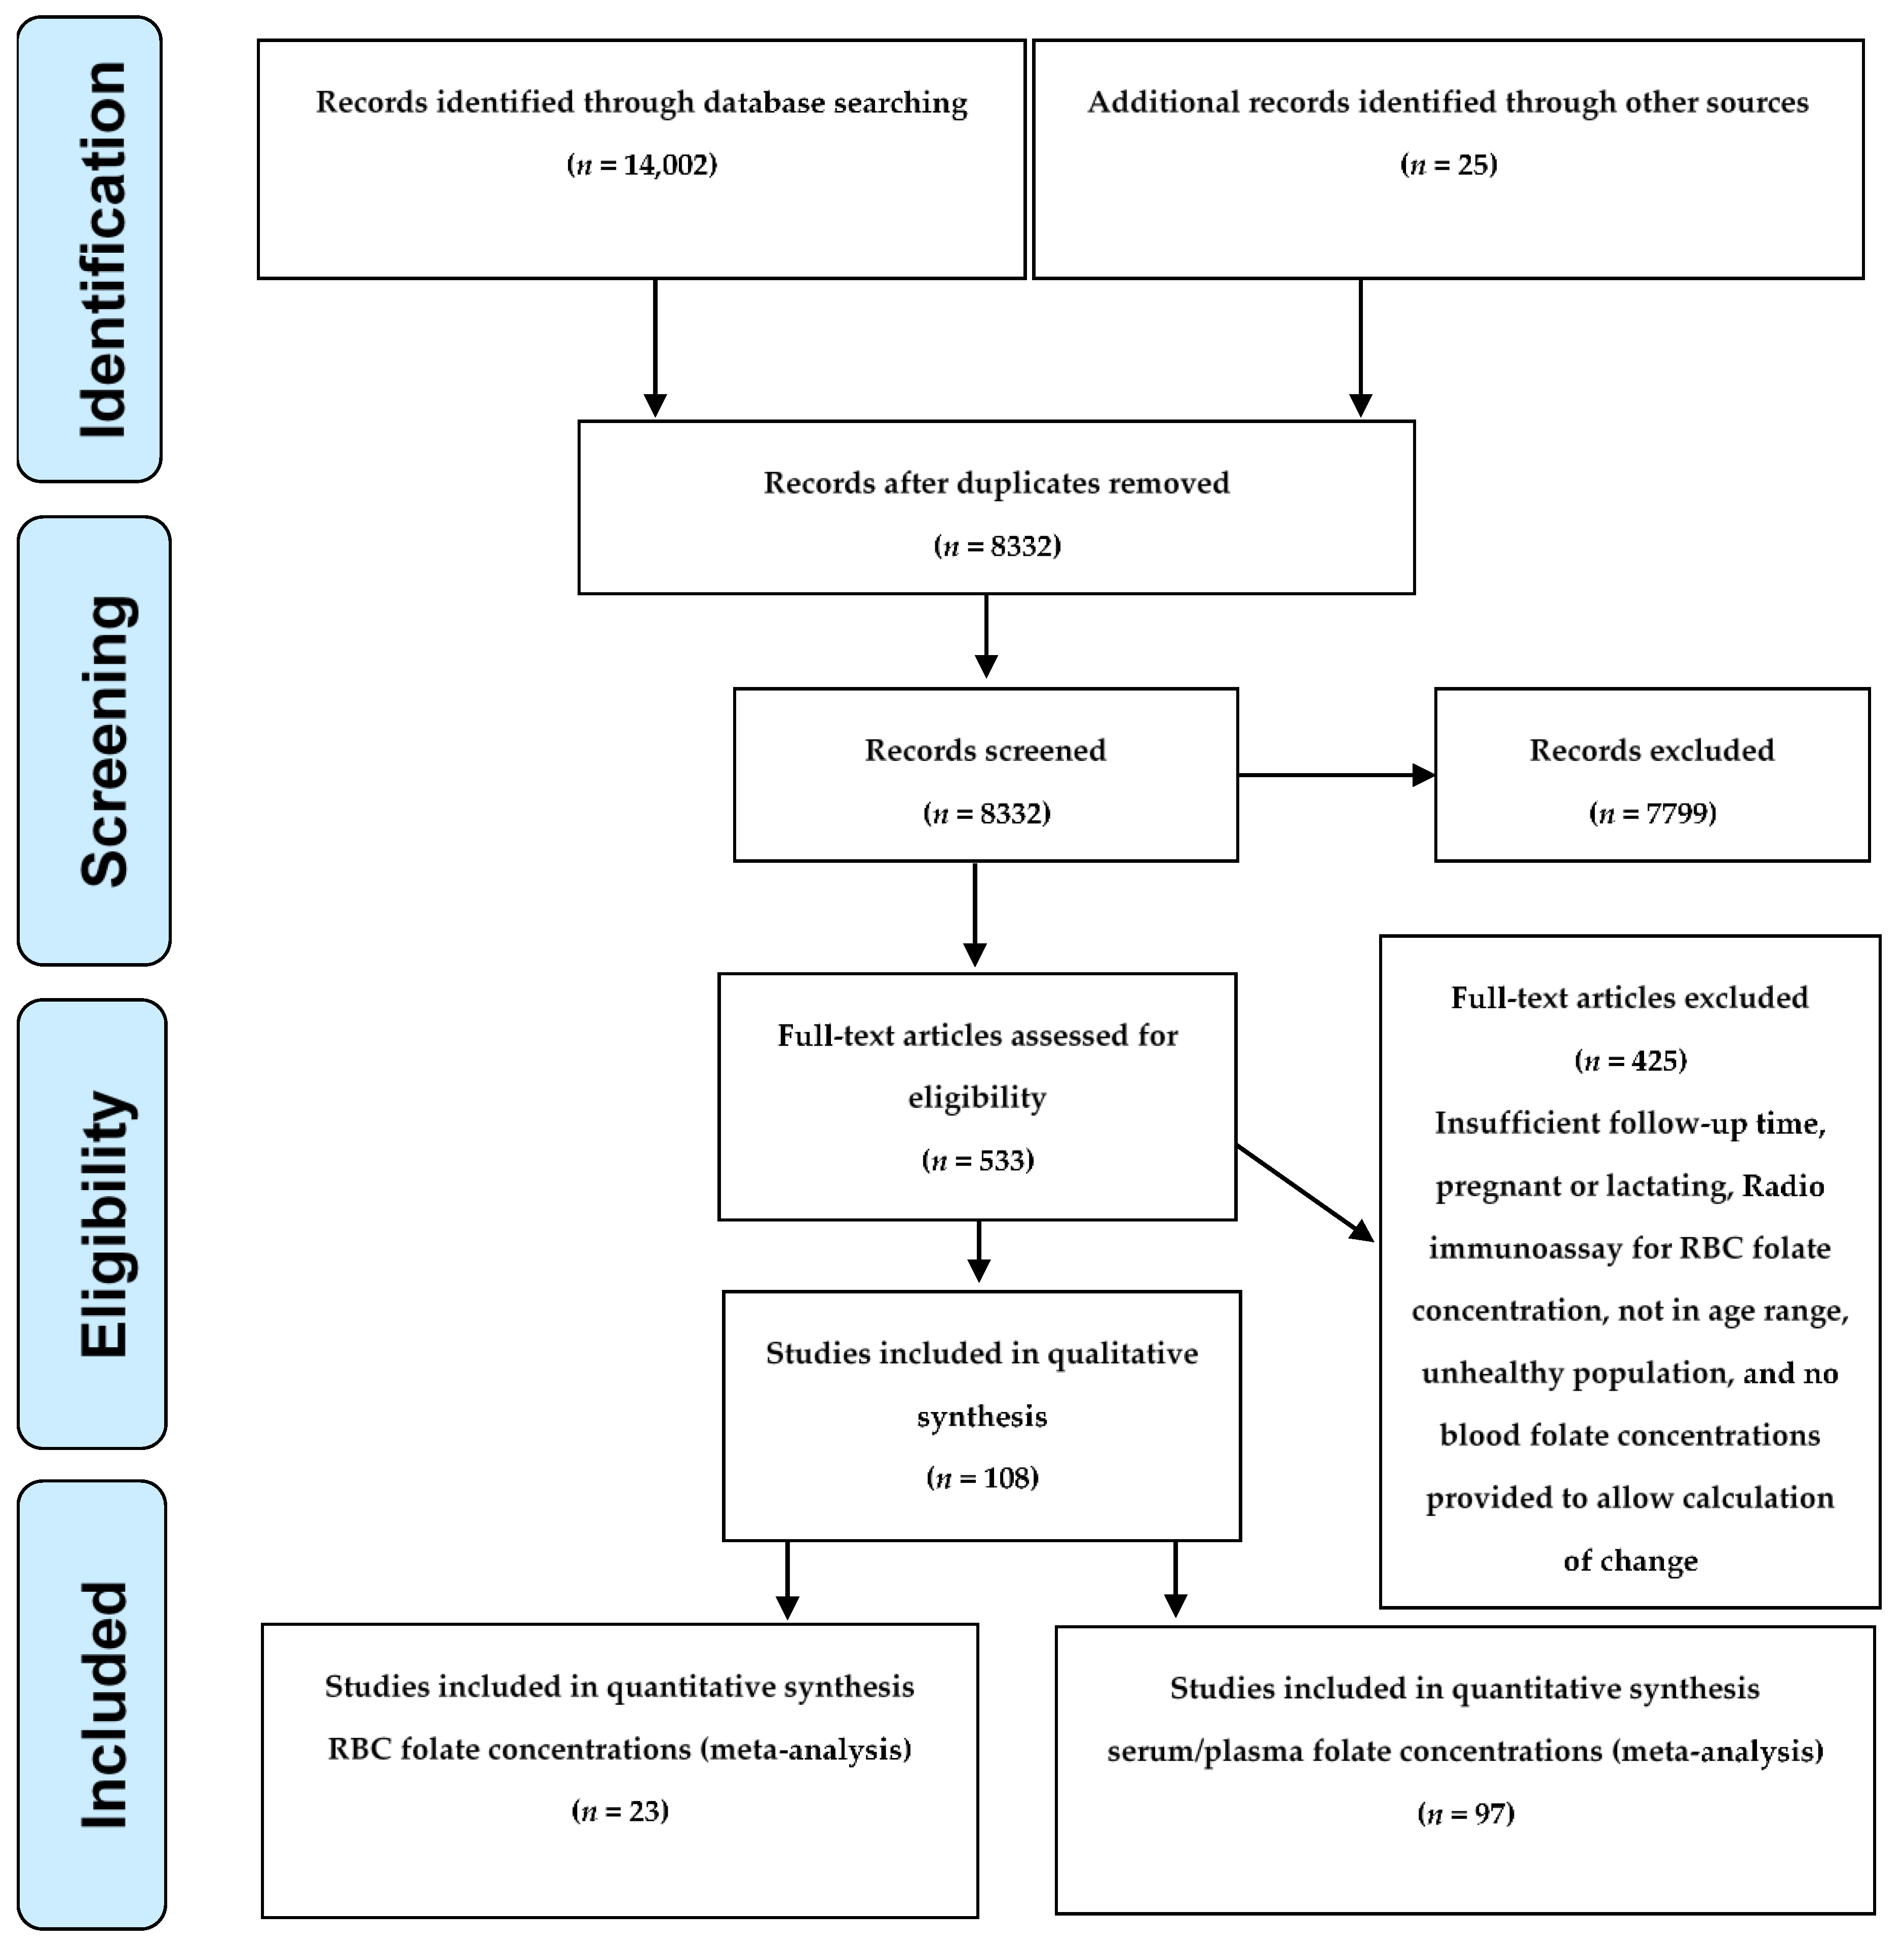
2.1. Systematic Review
2.2. Modeling Strategy
2.3. Estimation of the Time to Steady State
2.4. Sensitivity Analyses
2.5. Serum/Plasma Folate
3. Results
4. Discussion
4.1. Implications for Implementing the World Health Organization (WHO) Guidelines
4.2. Implications for Individual Women
4.3. Limitations
5. Conclusions
Supplementary Materials
Author Contributions
Funding
Conflicts of Interest
References
- Centers for Disease Control and Prevention. Recommendations for the use of folic acid to reduce the number of cases of spina bifida and other neural tube defects. MMWR Recomm. Rep. 1992, 41, 1–7. [Google Scholar]
- Institute of Medicine. Dietary Reference Intakes for Thiamin, Riboflavin, Niacin, Vitamin B6, Folate, Vitamin B12, Pantothenic Acid, Biotin, and Choline; National Academy Press: Washington, DC, USA, 1998. [Google Scholar]
- Prevention of Neural Tube Defects: Results of the Medical Research Council Vitamin Study. Lancet 1991, 338, 131–137. [CrossRef]
- Czeizel, A.E.; Dudas, I. Prevention of the first occurrence of neural-tube defects by periconceptional vitamin supplementation. N. Engl. J. Med. 1992, 327, 1832–1835. [Google Scholar] [CrossRef] [PubMed]
- Berry, R.J.; Li, Z.; Erickson, J.D.; Li, S.; Moore, C.A.; Wang, H.; Mulinare, J.; Zhao, P.; Wong, L.Y.; Gindler, J.; et al. Prevention of neural-tube defects with folic acid in China. China-U.S. Collaborative Project for Neural Tube Defect Prevention [corrected; erratum to be published]. N. Engl. J. Med. 1999, 341, 1485–1490. [Google Scholar] [CrossRef]
- Chen, L.T.; Rivera, M.A. The Costa Rican experience: Reduction of neural tube defects following food fortification programs. Nutr. Rev. 2004, 62, S40–S43. [Google Scholar] [CrossRef]
- De Wals, P.; Tairou, F.; Van Allen, M.I.; Lowry, R.B.; Evans, J.A.; Van den Hof, M.C.; Crowley, M.; Uh, S.H.; Zimmer, P.; Sibbald, B.; et al. Spina bifida before and after folic acid fortification in Canada. Birth Defects Res. A Clin. Mol. Teratol. 2008, 82, 622–626. [Google Scholar] [CrossRef]
- De Wals, P.; Tairou, F.; Van Allen, M.I.; Uh, S.H.; Lowry, R.B.; Sibbald, B.; Evans, J.A.; Van den Hof, M.C.; Zimmer, P.; Crowley, M.; et al. Reduction in neural-tube defects after folic acid fortification in Canada. N. Engl. J. Med. 2007, 357, 135–142. [Google Scholar] [CrossRef]
- Sayed, A.R.; Bourne, D.; Pattinson, R.; Nixon, J.; Henderson, B. Decline in the prevalence of neural tube defects following folic acid fortification and its cost-benefit in South Africa. Birth Defects Res. A Clin. Mol. Teratol. 2008, 82, 211–216. [Google Scholar] [CrossRef] [PubMed] [Green Version]
- Williams, J.; Mai, C.T.; Mulinare, J.; Isenburg, J.; Flood, T.J.; Ethen, M.; Frohnert, B.; Kirby, R.S.; Centers for Disease Control, Prevention. Updated estimates of neural tube defects prevented by mandatory folic acid fortification—United States, 1995–2011. MMWR Morb. Mortal. Wkly. Rep. 2015, 64, 1–5. [Google Scholar]
- Branum, A.M.; Ahrens, K.A. Trends in timing of pregnancy awareness among US women. Matern. Child Health J. 2017, 21, 715–726. [Google Scholar] [CrossRef] [PubMed]
- Food Standards: Amendment of Standards of Identity for Enriched Grain Products to Require Addition of Folic Acid. Final rule. 21 CFR Parts 136, 137, and 139. Fed Regist 1996, 8781–8789.
- Parker, S.E.; Mai, C.T.; Canfield, M.A.; Rickard, R.; Wang, Y.; Meyer, R.E.; Anderson, P.; Mason, C.A.; Collins, J.S.; Kirby, R.S.; et al. Updated national birth prevalence estimates for selected birth defects in the United States, 2004–2006. Birth Defects Res. A Clin. Mol. Teratol. 2010, 88, 1008–1016. [Google Scholar] [CrossRef] [PubMed]
- Grosse, S.D.; Ouyang, L.; Collins, J.S.; Green, D.; Dean, J.H.; Stevenson, R.E. Economic evaluation of a neural tube defect recurrence-prevention program. Am. J. Prev. Med 2008, 35, 572–577. [Google Scholar] [CrossRef] [PubMed]
- Hao, L.; Yang, Q.-H.; Li, Z.; Bailey, L.B.; Zhu, J.-H.; Hu, D.J.; Zhang, B.-L.; Erickson, J.D.; Zhang, L.; Gindler, J.; et al. Folate status and homocysteine response to folic acid doses and withdrawal among young Chinese women in a large-scale randomized double-blind trial. Am. J. Clin. Nutr. 2008, 88, 448–457. [Google Scholar] [CrossRef] [PubMed]
- Daly, L.E.; Kirke, P.N.; Molloy, A.; Weir, D.G.; Scott, J.M. Folate levels and neural tube defects. Implications for prevention. JAMA 1995, 274, 1698–1702. [Google Scholar] [CrossRef] [PubMed]
- Crider, K.S.; Devine, O.; Hao, L.; Dowling, N.F.; Li, S.; Molloy, A.M.; Li, Z.; Zhu, J.; Berry, R.J. Population red blood cell folate concentrations for prevention of neural tube defects: Bayesian model. BMJ 2014, 349, g4554. [Google Scholar] [CrossRef] [PubMed]
- Cordero, A.M.; Crider, K.S.; Rogers, L.M.; Cannon, M.J.; Berry, R.J. Optimal serum and red blood cell folate concentrations in women of reproductive age for prevention of neural tube defects: World Health Organization guidelines. MMWR Morb. Mortal. Wkly. Rep. 2015, 64, 421–423. [Google Scholar]
- Souverein, O.W.; Dullemeijer, C.; van’t Veer, P.; van der Voet, H. Transformations of summary statistics as input in meta-analysis for linear dose-response models on a logarithmic scale: A methodology developed within EURRECA. BMC Med. Res. Methodol. 2012, 12, 57. [Google Scholar] [CrossRef]
- Hartung, J.K.G.; Sinha, B. Statistical Meta Analysis with Applications; John Wiley and Sons: New York, NY, USA, 2008. [Google Scholar]
- Hanson, L.N.; Engelman, H.M.; Alekel, D.L.; Schalinske, K.L.; Kohut, M.L.; Reddy, M.B. Effects of soy isoflavones and phytate on homocysteine, C-reactive protein, and iron status in postmenopausal women. Am. J. Clin. Nutr. 2006, 84, 774–780. [Google Scholar] [CrossRef] [Green Version]
- Lunn, D.J.C.; Best, T.; Thomas, A.; Spiegehalter, D. A Practical Introduction to Bayesian Analysis; CRC Press: New York, NY, USA, 2013. [Google Scholar]
- Gelman, A. Posterior predictive assessment of model fitness via realized discrepancies. Statistica 1996, 6, 733–807. [Google Scholar]
- Tinker, S.C.; Hamner, H.C.; Qi, Y.P.; Crider, K.S. U.S. Women of childbearing age who are at possible increased risk of a neural tube defect-affected pregnancy due to suboptimal red blood cell folate concentrations, national health and nutrition examination survey 2007 to 2012. Birth Defects Res. A Clin. Mol. Teratol. 2015, 103, 517–526. [Google Scholar] [CrossRef] [PubMed]
- Duffy, M.E.; Hoey, L.; Hughes, C.F.; Strain, J.J.; Rankin, A.; Souverein, O.W.; Dullemeijer, C.; Collings, R.; Hooper, L.; McNulty, H. Biomarker responses to folic acid intervention in healthy adults: A meta-analysis of randomized controlled trials. Am. J. Clin. Nutr. 2014, 99, 96–106. [Google Scholar] [CrossRef] [PubMed]
- World Health Organization (WHO). Guideline: Optimal Serum and Red Blood Cell Concentrations in Women of Reproductive Age for Prevention of Neural Tube Defects; WHO: Geneva, Switzerland, 2015. [Google Scholar]
- Christensen, K.; Rozen, R. Genetic variation: Effect on folate metabolism and disease/birth defect risk. In Folate in Health and Disease; Bailey, L.B., Ed.; Taylor Francis: Milton Park, UK, 2013; Volume 2, pp. 145–166. [Google Scholar]
- Finer, L.B.; Zolna, M.R. Unintended pregnancy in the United States: Incidence and disparities, 2006. Contraception 2011, 84, 478–485. [Google Scholar] [CrossRef] [PubMed]
- Pfeiffer, C.M.; Sternberg, M.R.; Hamner, H.C.; Crider, K.S.; Lacher, D.A.; Rogers, L.M.; Bailey, R.L.; Yetley, E.A. Applying inappropriate cutoffs leads to misinterpretation of folate status in the US population. Am. J. Clin. Nutr. 2016, 104, 1607–1615. [Google Scholar] [CrossRef]
- Zhang, M.; Sternberg, M.R.; Pfeiffer, C.M. Harmonizing the calibrator and microorganism used in the folate microbiological assay increases the comparability of serum and whole-blood folate results in a CDC round-robin study. J. Nutr. 2018, 148, 807–817. [Google Scholar] [CrossRef]
- Tsang, B.L.; Devine, O.J.; Cordero, A.M.; Marchetta, C.M.; Mulinare, J.; Mersereau, P.; Guo, J.; Qi, Y.P.; Berry, R.J.; Rosenthal, J.; et al. Assessing the association between the methylenetetrahydrofolate reductase (mthfr) 677c>t polymorphism and blood folate concentrations: A systematic review and meta-analysis of trials and observational studies. Am. J. Clin. Nutr. 2015, 101, 1286–1294. [Google Scholar] [CrossRef] [PubMed]
- Marchetta, C.M.; Devine, O.J.; Crider, K.S.; Tsang, B.L.; Cordero, A.M.; Qi, Y.P.; Guo, J.; Berry, R.J.; Rosenthal, J.; Mulinare, J.; et al. Assessing the association between natural food folate intake and blood folate concentrations: A systematic review and bayesian meta-analysis of trials and observational studies. Nutrients 2015, 7, 2663–2686. [Google Scholar] [CrossRef] [PubMed]
- Bradbury, K.E.; Williams, S.M.; Green, T.J.; McMahon, J.A.; Mann, J.I.; Knight, R.G.; Skeaff, C.M. Differences in erythrocyte folate concentrations in older adults reached steady-state within one year in a two-year, controlled, 1 mg/d folate supplementation trial. J. Nutr. 2012, 142, 1633–1637. [Google Scholar] [CrossRef] [PubMed]


| Folic Acid Dose (µg/day) | Number of Studies Used for Each Analysis * | Maximum Follow-up in Weeks in Each Analysis | Estimated Ratio of Steady-state to Baseline Folate Concentrations (95% Credible Interval) | 95% Posterior Predictive Interval ŧ | Estimated Weeks to Reach Steady-state (95% Credible Interval) | |
|---|---|---|---|---|---|---|
| RBC folate concentrations | ||||||
| 375–570 | 17 | 48 | 1.78 (1.66, 1.93) | 1.37, 2.34 | 36 (27, 52) | |
| Serum/Plasma folate concentrations | ||||||
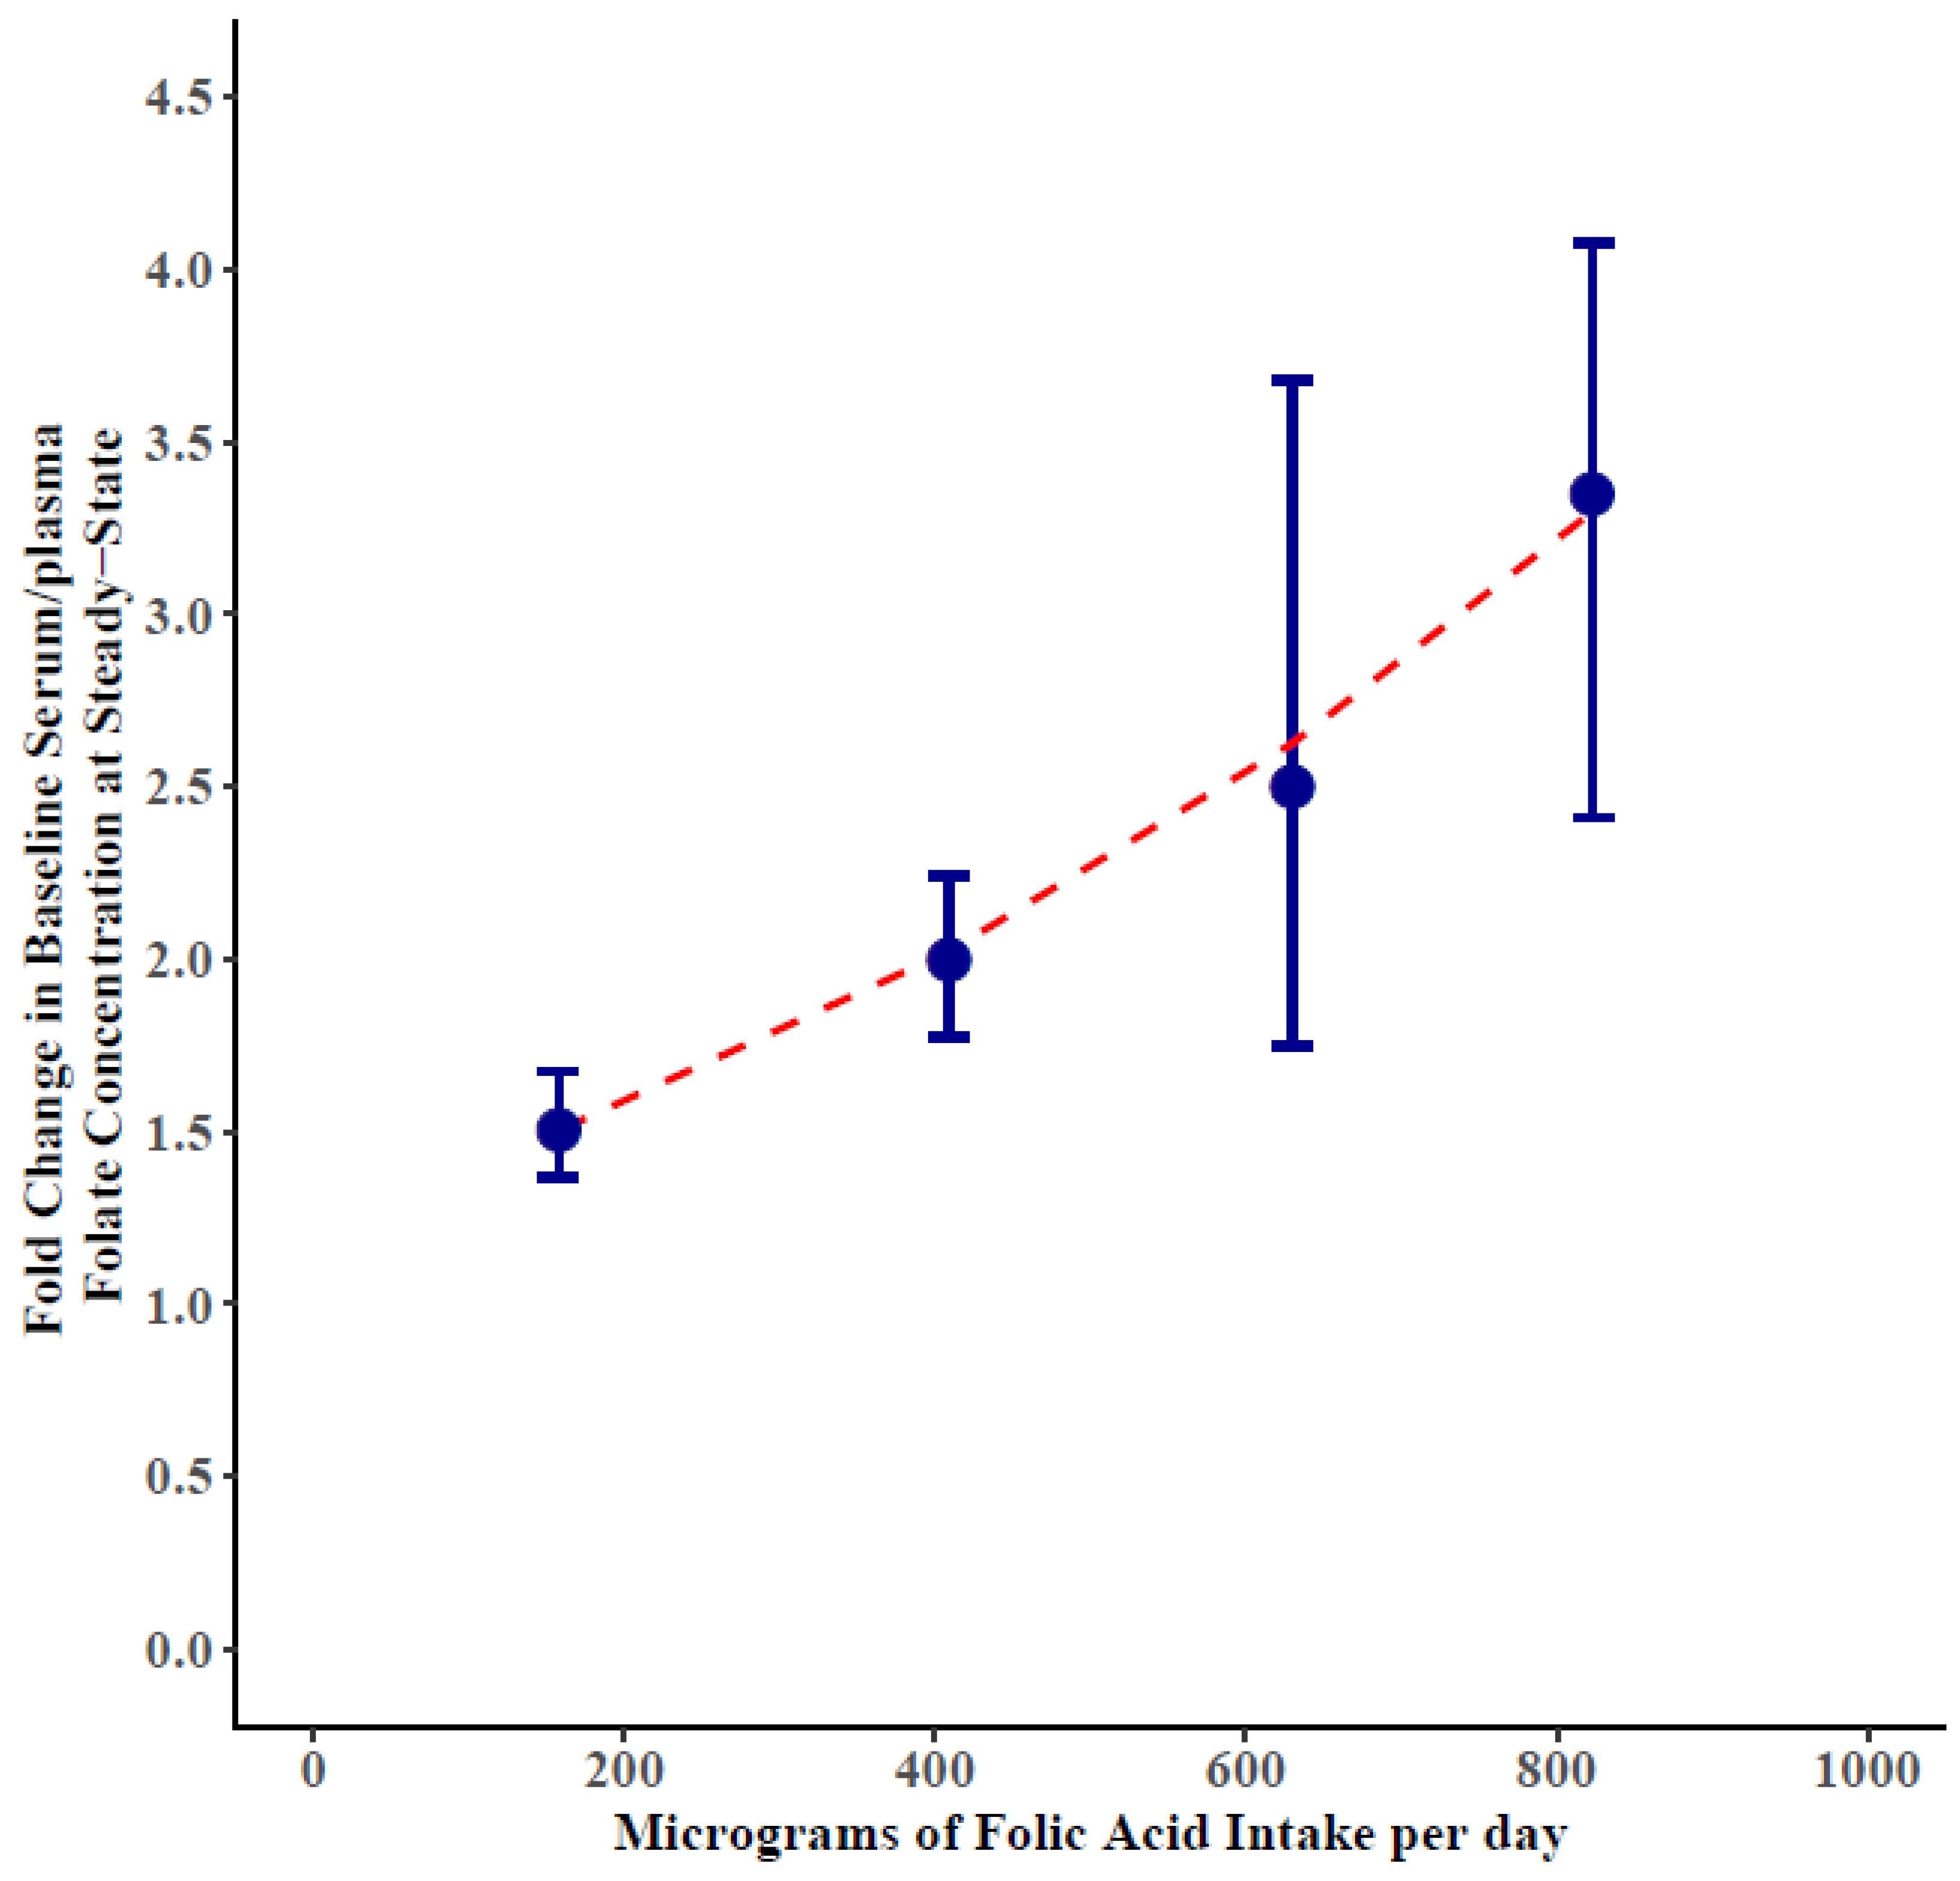
| 50–250 | 35 | 48 | 1.50 (1.40, 1.62) | 1.03, 2.20 | 8 (3, 12) | |
| 300–500 | 53 | 120 | 2.00 (1.81, 2.21) | 0.96, 4.18 | 13 (10, 16) | |
| 563–714 ˠ | 7 | 24 | 2.50 (1.76, 3.64) | 0.80, 7.94 | 11 (7, 17) | |
| 800–1429 | 25 | 144 | 3.35 (2.76, 4.05) | 1.25, 9.02 | 15 (11, 20) |
| Folic Acid Dose (µg/day) | Strata | Number of Studies * | Maximum Follow-up in Weeks * | Estimated Ratio of Steady-state to Baseline Folate Concentration | 95% Credible Interval | 95% Posterior Predictive Interval ŧ | |
|---|---|---|---|---|---|---|---|
| RBC folate concentrations | |||||||
| 375–570 | |||||||
| Risk of Bias | |||||||
| High | 9 | 48 | 1.50 | 1.35, 1.66 | 1.15, 1.95 | ||
| Low, Medium | 8 | 40 | 1.81 | 1.66, 2.00 | 1.33, 2.49 | ||
| RBC folate initial values (nmol/L) | |||||||
| <615 | 9 | 24 | 1.85 | 1.70, 2.02 | 1.38, 2.52 | ||
| ≥615 | 8 | 48 | 1.43 | 1.32, 1.58 | 1.18, 1.77 | ||
| Serum/Plasma folate concentrations | |||||||
| Risk of Bias | |||||||
| 50–250 | High | 21 | 24 | 1.40 | 1.27, 1.53 | 0.95, 2.06 | |
| Low, Medium | 14 | 48 | 1.62 | 1.46, 1.80 | 1.09, 2.42 | ||
| 300–500 | |||||||
| High | 33 | 120 | 2.19 | 1.85, 2.58 | 0.94, 5.20 | ||
| Low, Medium | 20 | 40 | 1.89 | 1.66, 2.18 | 0.99, 3.64 | ||
| 800–1429 | High | 12 | 24 | 3.19 | 2.44, 5.21 | 1.09, 10.81 | |
| Medium | 13 | 144 | 3.35 | 2.44, 4.44 | 1.04, 10.42 | ||
| Serum/plasma initial values (nmol/L) | |||||||
| 50–250 | <15.6 | 17 | 48 | 1.66 | 1.49, 1.85 | 1.09, 2.55 | |
| ≥15.6 | 18 | 48 | 1.37 | 1.27, 1.50 | 1.00, 1.87 | ||
| 300–500 | <16.4 | 21 | 120 | 2.52 | 2.06, 2.98 | 1.07, 5.89 | |
| ≥16.4 | 32 | 48 | 1.64 | 1.49, 1.82 | 0.99, 2.70 | ||
| 800–1429 | <12.5 | 12 | 144 | 4.41 | 3.78, 4.93 | 2.82, 6.66 | |
| ≥12.5 | 13 | 30 | 2.64 | 2.06, 3.57 | 0.94, 7.95 | ||
| Age years | |||||||
| 50–250 | ≤50 | 22 | 48 | 1.46 | 1.32, 1.62 | 0.93, 2.28 | |
| >50 | 13 | 48 | 1.57 | 1.41, 1.75 | 1.15, 2.14 | ||
| 300–500 | ≤50 | 32 | 48 | 2.01 | 1.75, 2.30 | 0.91, 4.36 | |
| >50 | 21 | 120 | 2.02 | 1.74, 2.35 | 0.96, 4.22 | ||
| 800–1429 | ≤50 | 10 | 30 | 3.53 | 2.59, 4.99 | 1.27, 9.97 | |
| >50 | 15 | 144 | 3.04 | 2.33, 4.08 | 0.92, 10.07 |
© 2019 by the authors. Licensee MDPI, Basel, Switzerland. This article is an open access article distributed under the terms and conditions of the Creative Commons Attribution (CC BY) license (http://creativecommons.org/licenses/by/4.0/).
Share and Cite
Crider, K.S.; Devine, O.; Qi, Y.P.; Yeung, L.F.; Sekkarie, A.; Zaganjor, I.; Wong, E.; Rose, C.E.; Berry, R.J. Systematic Review and Bayesian Meta-analysis of the Dose-response Relationship between Folic Acid Intake and Changes in Blood Folate Concentrations. Nutrients 2019, 11, 71. https://doi.org/10.3390/nu11010071
Crider KS, Devine O, Qi YP, Yeung LF, Sekkarie A, Zaganjor I, Wong E, Rose CE, Berry RJ. Systematic Review and Bayesian Meta-analysis of the Dose-response Relationship between Folic Acid Intake and Changes in Blood Folate Concentrations. Nutrients. 2019; 11(1):71. https://doi.org/10.3390/nu11010071
Chicago/Turabian StyleCrider, Krista S., Owen Devine, Yan Ping Qi, Lorraine F. Yeung, Ahlia Sekkarie, Ibrahim Zaganjor, Eugene Wong, Charles E. Rose, and Robert J. Berry. 2019. "Systematic Review and Bayesian Meta-analysis of the Dose-response Relationship between Folic Acid Intake and Changes in Blood Folate Concentrations" Nutrients 11, no. 1: 71. https://doi.org/10.3390/nu11010071