According to the IPCC (2013), global sea levels rose by less than two-tenths of a meter (0.19 m) between 1901 and 2010. Considering the scientific record of long-term sea level trends from locations across the globe, this small <0.2 m change in sea levels over the course of the last 110 years does not even fall outside the range of natural variability.
Sea levels have commonly risen and fallen at amplitudes much greater than two-tenths of a meter. As Harris et al. (2015) confirm, “relative sea-level variations of ∼1 m were common throughout the Holocene.”
For example, consider Bracco et al. (2014). These scientists found that sea levels along the coasts of South America were a full 4 meters higher than they are now between 5,500 and 6,000 years ago. Then, over the course of just a 400-year time span (between 4,700 -4,300 years ago), sea levels dropped by a full 3 meters (to +1 meter above today’s levels), then rose by 2 meters (to +3 meters above today’s levels), and then fell to current levels after 4,300 years ago. Here’s what these long-term sea-level oscillations look like graphed (Fig. 5):
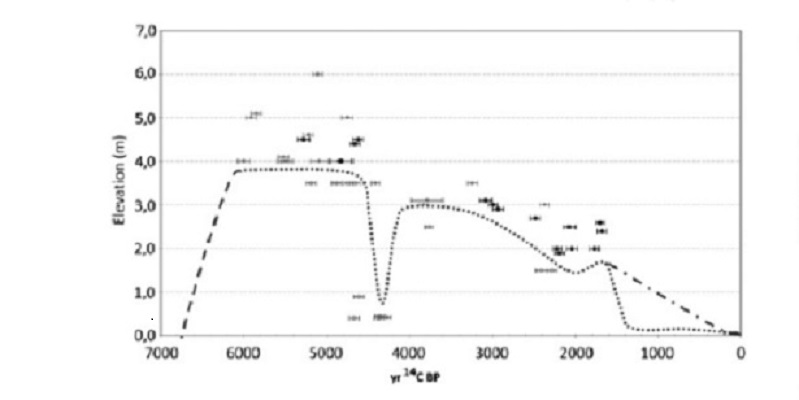
These rapid variations in sea levels pose critical explanatory problems for advocates of the AGW (anthropogenic global warming) supposition that human CO2 emissions, and not internal Earth-system dynamics, are what drive sea level changes. Specifically, AGW advocates presume that rising CO2 concentrations cause sea levels to rise (and lowering CO2 concentrations cause sea levels to fall). A large volume of rapidly accumulating scientific evidence not only does not support this CO2-rise-causes-sea-level-rise supposition, it suggests that a long-term inverse correlation could just as easily be formulated: As CO2 rises, sea levels decline.
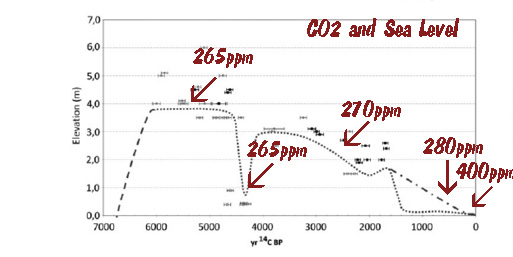
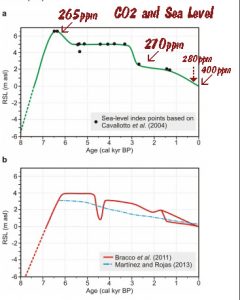
To illustrate this, consider the Bracco et al. (2014) graph above depicting meters-per-century variations in sea levels with the corresponding CO2 concentration recorded for each period. Notice that the highstand period (5,000 to 6,000 years ago) had lower concentrations of CO2 than the following millennia that subsequently had higher CO2 concentrations. Also, consider that there was no significant change in CO2 levels during the 400 years of rapid sea level changes. Finally, notice that the last 200 years of sea level changes (if there have been any) are undetectable on this scale at this location even though CO2 concentrations were rising from 280 ppm to 400 ppm during this period.
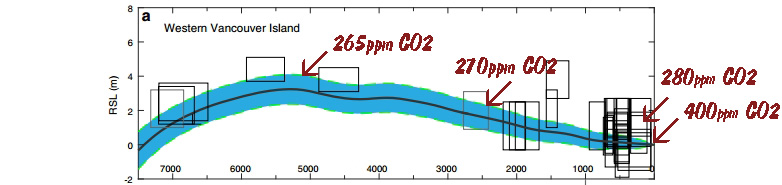
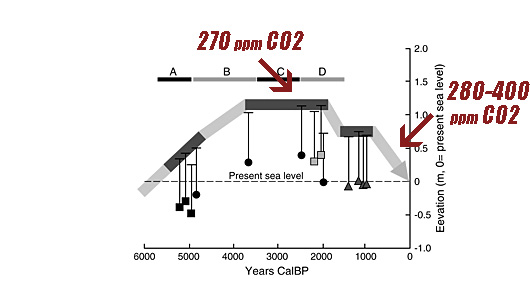
And this isn’t just true for the coasts of South America. In the peer-reviewed scientific literature, a non-correlation — or inverse correlation — for CO2 and sea level (as CO2 rises, sea levels fall) has been reported by scientists for dozens of locations across the globe just in the last few years alone. Graphs (with CO2 ppm concentrations, text, and arrows added) for a few other locations are shown below.
Prieto et al., 2016 (Argentina, Uruguay)
Dura et al., 2016 (Vancouver Island)
Kench et al., 2014 (central Pacific Ocean)
But not only is the CO2-rise-causes-sea-level-rise AGW supposition dubious, so is the entire paradigm of an alarming and catastrophic human-caused sea-level rise future.
– See more at: http://notrickszone.com/2016/08/29/30-scientific-papers-reveal-inverse-co2-sea-level-signal-as-co2-rises-sea-level-falls/#sthash.En4P6f5t.dpuf