Introducing The Website Speed Test Image Analysis Tool

Email Newsletter
Weekly tips on front-end & UX.
Trusted by 200,000+ folks.

 Flexible CMS. Headless & API 1st

Web developers spend their days writing hypertext, but, byte for byte, most of the web is composed of images. It is hard to overstate the effect that images have on the average web page’s performance; faster websites have broader reach and a higher impact. The first and most important thing you can do to improve the performance of your website’s images is figure out how to measure them.
Enter Website Speed Test, a free and drop-dead-simple tool that leverages our (Cloudinary’s) image smarts to let you measure, diagnose and (crucially) communicate about the image performance of any website. Better yet, it’s built on top of, and integrated in, Pat Meenan’s WebPagetest.
Interested? Read on!
What Does It Do?
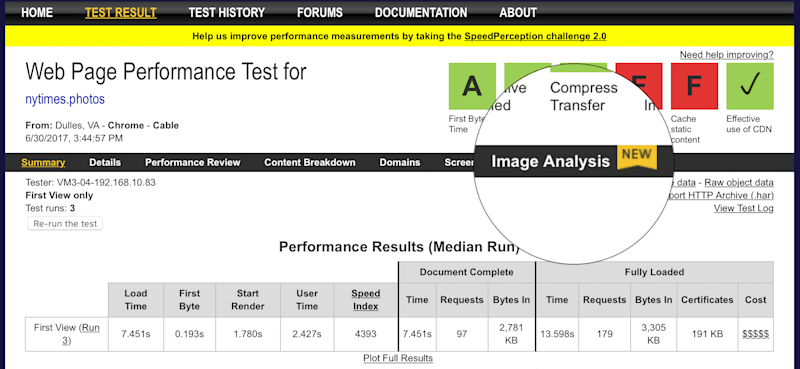
Let’s start by looking at what Website Speed Test specifically does. We’ll start by giving it a URL — say, nytimes.photos — and pressing “Analyze.”
Tests take a minute or two to run and return a page full of results.
Measure Overall Performance
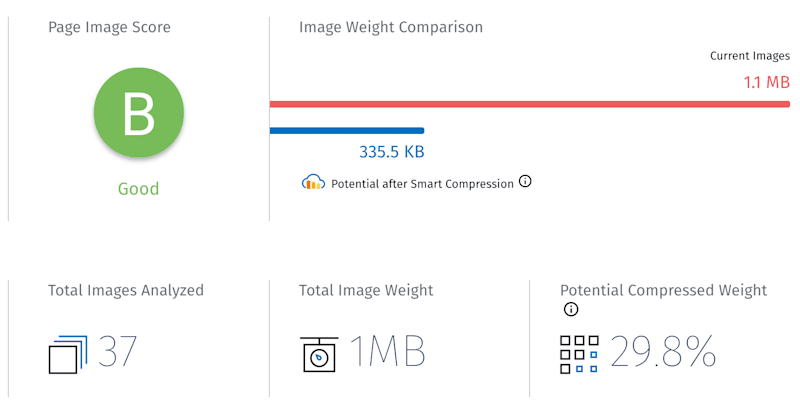
At the very top of these results, you’ll find the two most important pieces of information in the whole report: a letter grade, which attempts to capture all of the page’s good and bad decisions and reduce them down to a single simple metric, and an image weight comparison which shows you, quantitatively, the cost of all of those decisions. More on the letter grade in a minute. First, I want to address how the test calculates “cost”.
In order to calculate cost, the tool has to have some sort of optimal baseline to measure against. It has to be able to say, “Here’s what you could have done with your images, but — oops! — here’s what you did, and so here’s what you could save.” Constructing that baseline is a hard problem because images are complicated and quality is subjective. As luck would have it, Cloudinary has spent years building a suite of tools intended to optimally and automatically encode images for delivery on the web. Website Speed Test takes those tools — which have, to date, been used to create performant images — and turns them inside out, into something that can measure image performance. Cool!
OK, so that’s how the test calculates costs. What about the letter grade?
When I first started running tests, I didn’t understand why some websites whose images were an order of magnitude (or two!) larger than the baseline were still getting a B, while other websites, whose total image weight was “only” 1.5 or 2 times heavier than the baseline might get a C or D.
The answer is that the letter grade reflects how many mistakes opportunities for improvement the page contains, but it doesn’t so much care about the magnitude of those mistakes. Let’s say you’ve expertly crafted a page full of dozens of well-optimized images, and then your crappy colleague, Chad, comes along and drops a stinker of a 6 MB stock photo right smack dab in the header. Chad is the worst, but one bad decision on a page full of good ones won’t have a significant impact on your overall grade — even if it does ruin your total page weight.
On the other hand, let’s say you have a page that’s serving up a mix of wildly undersized or overcompressed images to go along with its enormous bloated ones. Its total page weight might not be that bad — but its problems are endemic. As such, it will get a terrible grade alongside its respectable-looking total weight.
The tool provides two metrics because the metrics do two different jobs. The weight comparison counts bytes, and the grade counts problems. Pay attention to both!
Diagnose Specific Issues
Now that we have a sense of the overall performance of the whole page, it’s time to dive in, look at individual images and diagnose specific problems.
Each image on a tested page gets its own little mini-report.
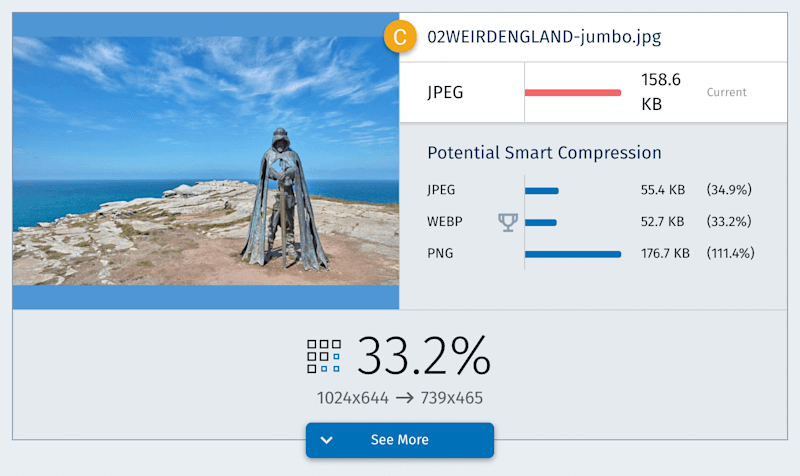
This shows you both what you did (how your image was sized and encoded) and what you should have done (the format, dimensions and optimally compressed file size you could have delivered, instead). We are again presented with two big summary metrics: a letter grade and a potential savings percentage. But to really understand those metrics, we have to hit “See more.”
There’s a lot going on in the expanded section of the report. It’s divided into three panels. Let’s break down each of them, from left to right.
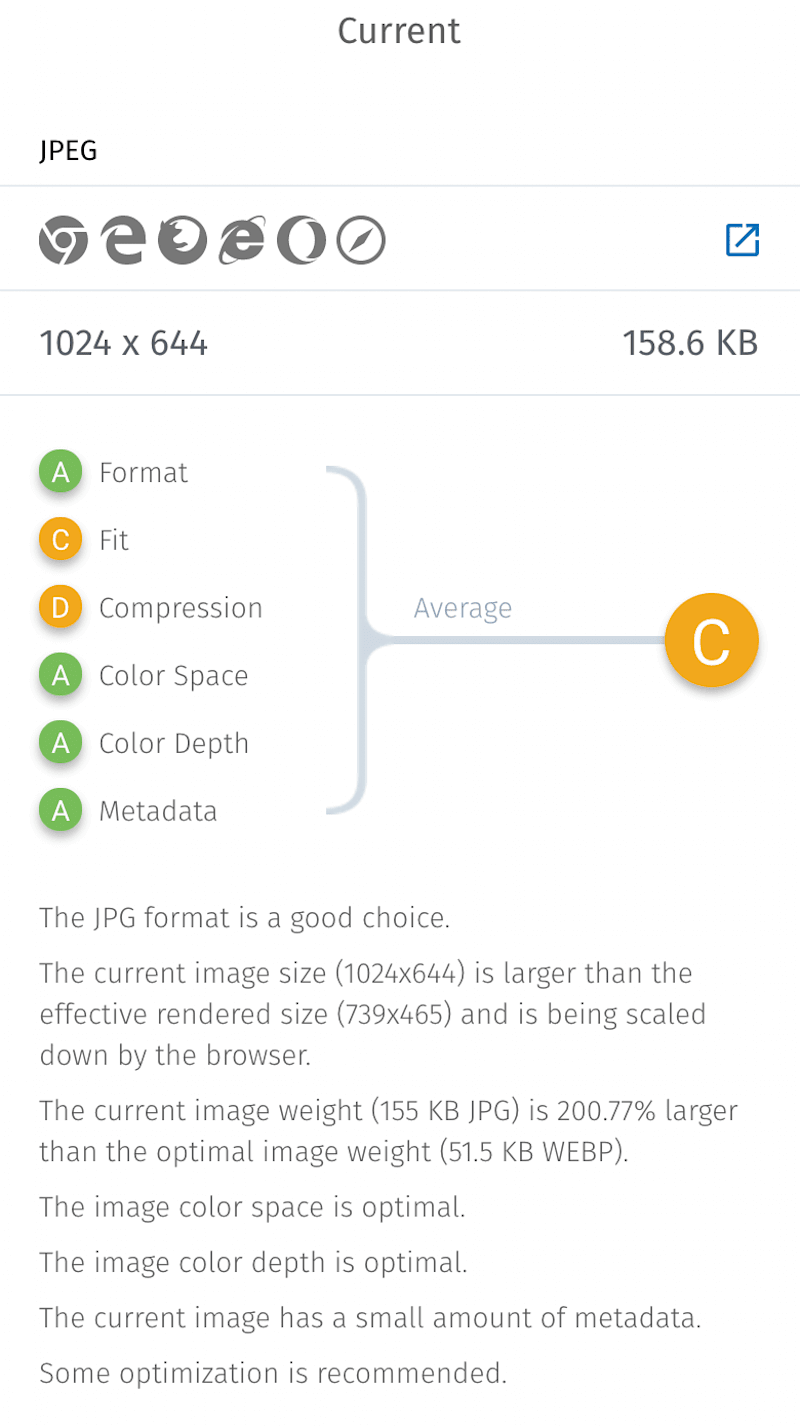
First, there’s the “Current” panel, which goes into detail about the image as it exists on the page. It’s here that we get to the roots of all of the letter grades that are being assigned at higher levels of the report. I wrote generally about “mistakes” earlier; in the “Current” tab, we can see the specific mistakes that Website Speed Test is actually checking for. The first three count towards your grade:
- Format. Is the image’s format a good match for its content? For example, did we use a GIF for our logo when we should have used a PNG? Would this JPEG have compressed better as a WebP?
- Fit. Are the image’s intrinsic dimensions a good fit for the layout and screen? For example, if the image appears at 100 px across on a 2× screen, we should be sending something close to a 200-pixel-wide image. Are we?
- Compression. Do the image’s quality settings strike a good balance between visual quality and file size?
Those three factors are what the test is most concerned with. Below them, you’ll see three others, which don’t actually factor into the image’s grade but are provided to highlight common, specific problems that might require special attention:
- Color space. Is the image encoded in a reasonable color space for the web, such as sRGB?
- Color depth. Are we using the right number of bits per pixel to encode color values? For instance, sRGB images should always be encoded with 8-bits per pixel.
- Meta data. Are we keeping the embedded meta data down to a minimum? Reader, I have seen 20 KB images saddled with 100 KB of invisible meta data. Shine a light!
After handing out grades, the test explains them and tells us what could have been done better. For example, the nytimes.photos image above was too big for the layout; JPEG was a reasonable choice, but we could have used WebP; and we really, really should have dialed up the compression.
What’s better than being told about a problem? Being given a recipe for how to fix it. And what’s even better than that? Being handed a finished solution on a metaphorical platter! So, on to our next panel, “Optimized Image.”
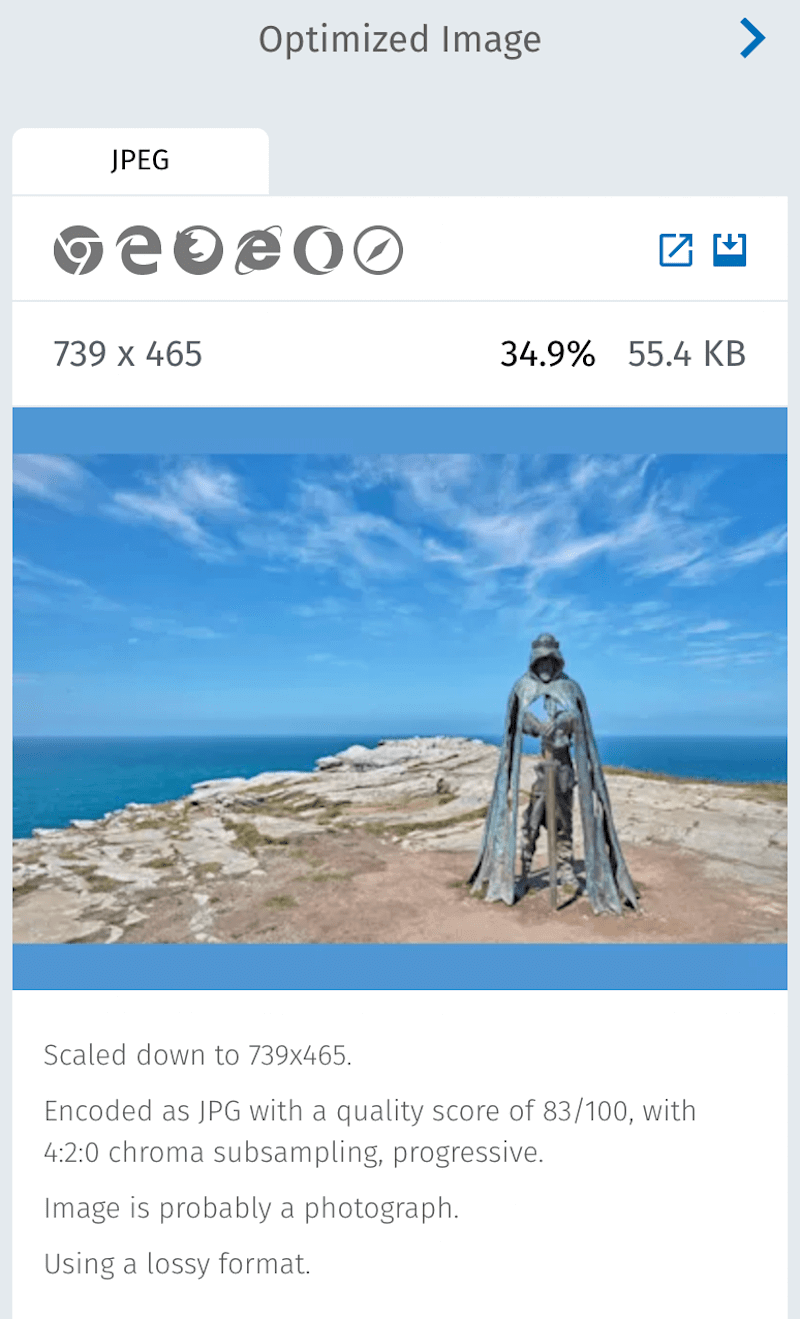
Here, we can see (and download!) the well-optimized image that the tool generated and measured against. We get a detailed description of the settings that were used to encode it and a few interesting tidbits about the image’s actual content, which Cloudinary has figured out along the way.
Due to limited real estate and relative importance, the last panel is tucked away off screen. So, hit the little chevron and behold, “Format Alternatives.”
The test encodes your image in every possible format, in order to determine which one is best. If the “best” format happens to be WebP or JPEG-XR, then you’ll probably need a JPEG or PNG fallback resource, for non-supporting browsers. You can see, download and read details about those alternate versions in this panel.
From Diagnosis To Treatment
For all but the smallest and most static of websites, using Website Speed Test as a sort of elaborate “Save for web” like this isn’t going to be very practical. You’re going to need to figure out how to fix the problems that the tool finds in a more systematic way. How you’ll do that will vary widely depending on your workflow and on the problem you’re solving. To solve compression problems, perhaps you could start using or even semi-automating excellent compression GUIs such as ImageOptim, ImageAlpha and Squash, or break out your terminal and start scripting up ImageMagick. For problems of fit, you’re probably going to need to do something about your website’s responsive images. And if the tool shows you that you’re missing out on big potential gains from newer formats such as WebP, the best thing to do is to start adopting them — making sure to use either server-side or in-markup type switching, so that you don’t send new formats to non-supporting browsers.
If automating all of this yourself sounds like a tremendous amount of work, well, it is! And there are a number of image hosting services that will gladly automate that work, for you.
OK, now that we’ve taken a tour of the metrics that the tool provides, the problems that it finds, and the solutions that it offers, I’d like to take a minute to discuss an important (and handy) aspect of how it actually works.
Website Speed Test Is Built On Top Of WebPagetest
What is Website Speed Test actually doing during the minute or two after you click “Analyze Images”? Mostly, nothing! Website Speed Test immediately hands the URL in question off to a different tool: Patrick Meenan’s indispensable WebPagetest. Website Speed Test then sits back and waits for WebPagetest to do all of the hard work of loading and measuring the page and its contents.
Only after the WebPagetest API returns a set of results can Website Speed Test comb those results for images and get to work recompressing, measuring and grading them.
In other words, Website Speed Test stands on the shoulders of WebPagetest and couldn’t operate without it. So, it was exciting, to say the least, when Patrick agreed to integrate Website Speed Test right into WebPagetest!
WebPagetest has a new tab in its navigation bar: “Analyze Images.” Click it and the current set of WebPagetest results will be shipped off to Website Speed Test for further image analysis. This is terrific, for two reasons.
First, it means that, if you are already using WebPagetest, then Website Speed Test is only ever a click away. (And once you’re working with an existing WebPagetest result, Website Speed Test works much faster.)
Secondly, you can send any WebPagetest result to Website Speed Test. WebPagetest is a mature, featureful tool. It offers up a whole bunch of useful settings that aren’t available when you initiate tests directly from webspeedtest.cloudinary.com. For instance, when you enter a URL into the big box on webspeedtest.cloudinary.com, pages are tested using a single default browsing environment: Google Chrome, with a 1366 × 784 viewport and a device-pixel-ratio of 1x. It’s impossible to get a complete picture of the page’s responsive image performance from that single environment. If the page being tested doesn’t scale images down to fit smaller low-resolution displays, or scale them up to look crisp on giant 5K screens, then we’re missing out on huge performance and UX opportunities — opportunities that Website Speed Test and its single default browsing environment aren’t able to reveal. Wouldn’t it be better to test our page across a wide variety of devices?
By starting from webpagetest.org and running multiple tests across different environments, using either the (convenient) “Browser” dropdown menu or (powerful) scripts, we can do exactly that.
Big differences in results from tests run in different environments are an indication that the tested page isn’t doing anything with responsive images, and probably should.
Hopefully, future iterations of Website Speed Test will implement smarter responsive image testing out of the box, so that these sorts of cross-device problems can be caught and highlighted after a single test. For now, though, integration in WebPagetest provides an access point that lets you accomplish the same thing with a bit of extra work.
Who’s It For?
I’ve written most of this article under the assumption that you, reader, are testing your own websites and are looking for problems that you’ll be empowered to solve.
Indeed, that’s primarily what the tool is intended to do: help developers build better websites. It highlights specific problems and offers concrete solutions.
I think that the test will also prove to be useful as a tool for communicating with and convincing stakeholders. Again, image optimization is one of the best things that anyone can do for the performance of a page; it’s also pretty complicated. Website Speed Test excels at reducing myriad nitty-gritty details down to easily digestible metrics — and then progressively disclosing technical detail as needed. This allows Website Speed Test reports to be understood by a wide variety of readers, with vastly different levels of technical expertise. So, whether you’re using it to show a client that their page has the potential to load two or three times faster, or you’re using it yourself to understand the potential impact of 4:2:0 chroma subsampling, Website Speed Test is there to help.
Room For Improvement
Website Speed Test is under active development, and this is just a first release. We have a few ideas about where to take it from here. I’ve already mentioned better testing for responsive images. A “Download all” button is in the works, too. If you have your own ideas (or if you find any bugs), we want to hear about them.
Finally, if you’ve somehow read this far without trying Website Speed Test for yourself, check it out!
Further Reading
- How Marketing Changed OOP In JavaScript
- Recovering Deleted Files From Your Git Working Tree
- Answering Common Questions About Interpreting Page Speed Reports
- Modern Methods For Improving Drupal’s Largest Contentful Paint Core Web Vital


