In previous blogs we’ve discussed positive lags which should be only used in a limited way. And, if used, should come with a note of explaining it’s use. Here we look at how to add graphics and text to the Gantt chart to document a positive lag in Microsoft Project.
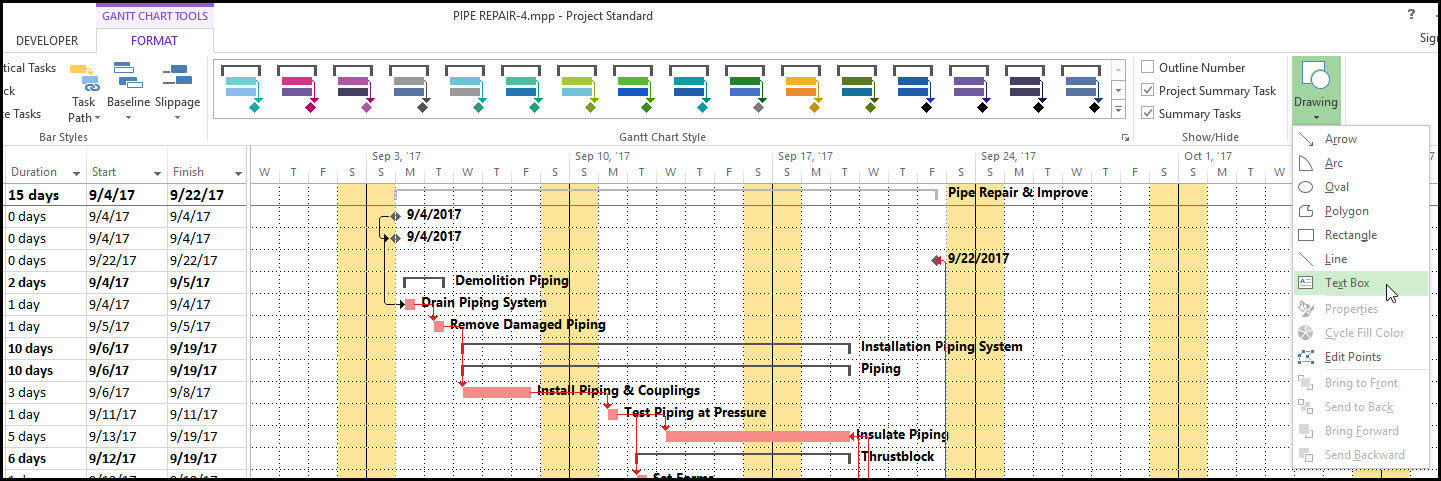
Yes, Microsoft Project has basic drawing features to add graphics and text to the Gantt chart. Finding where the drawing features are hidden has frustrated users. You can find them in the Format tab, and far right drawings ribbon group. To document our positive lag we want to insert an arrow and a text box. Both the arrow and text box are available in the drawing drop down menu, Figure 1.
 Figure 1
Note how we called out the positive lag in Microsoft Project between pour concrete and strike forms directly on the Gantt chart, Figure 2.
Figure 2
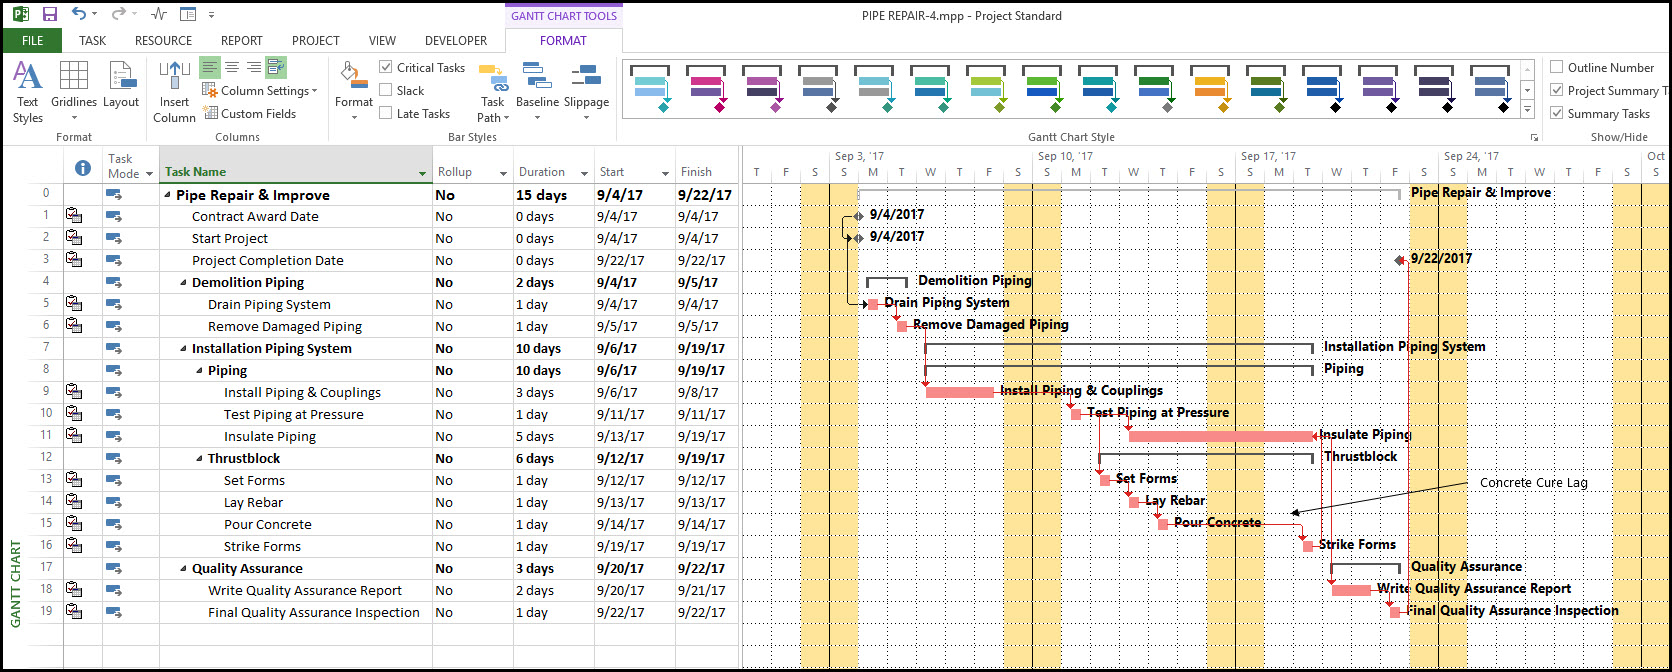
It is also possible to insert a note on strike forms to document the lag on the predecessor cure concrete. But calling out the concrete cure lag directly on the Microsoft Project Gantt chart puts the lag explanation front and center stage, and therefore, may be preferred.