Local tax dollars are a major source of K-12 education funding in Tennessee. In fact, how the state and local governments split these costs is a central issue in current discussions about reforming the Basic Education Program (BEP), the state’s education funding formula. This policy brief explores the mix of state and local education funding in Tennessee from 1992-2020 and highlights six key findings about school district finances.
Key Takeaways
- State and local revenues for Tennessee schools have grown at about the same pace since 1998, when the BEP was first fully implemented.
- The state’s share of school district revenues is about the same as when the BEP was initially phased-in.
- The reliance on state funding varies significantly from one district to another but has grown for most districts over time.
- School districts pick up a larger share of school funding than the BEP requires.
- Districts with higher fiscal capacity must rely more on local funding, but they also tend to contribute the most in excess of BEP requirements.
- Tennessee’s reliance on state education dollars is in line with the national average.
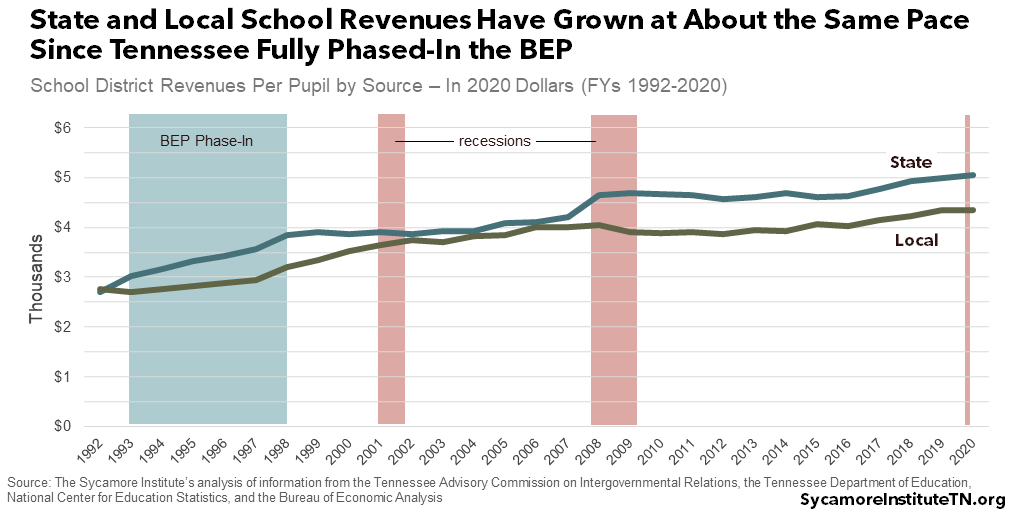
1. State and local revenues for Tennessee schools have grown at about the same pace since 1998, when Tennessee first fully phased in the BEP.
The BEP was passed in 1992 and fully phased in by FY 1998. (1) Since FY 1998, per pupil revenues from both state and local sources grew by about 1.4% per year on average after adjusting for inflation (Figure 1). That’s an increase of $61 per student per year from state revenues and $52 from local revenues. (2) (3) (4) (5)
Figure 1
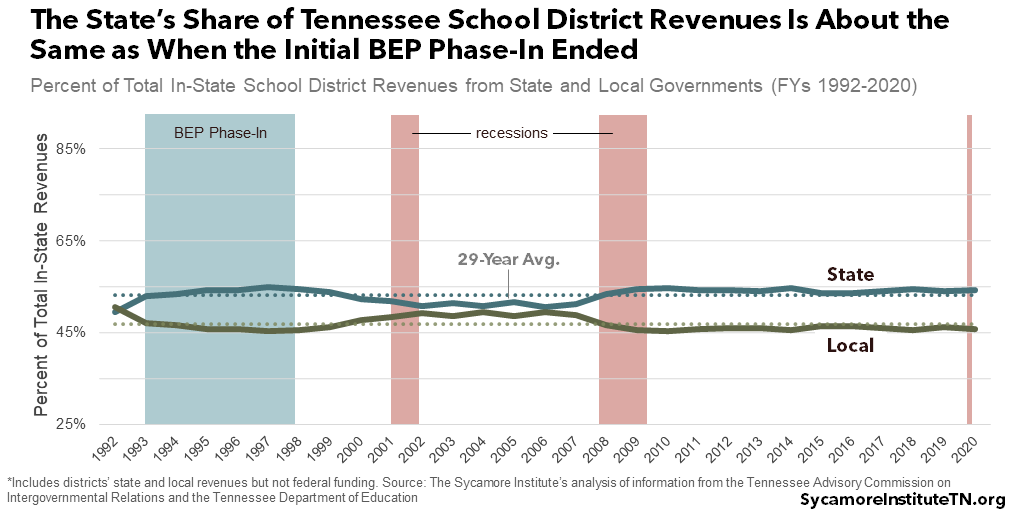
2. The state’s share of school district revenues is about the same as when the BEP was initially fully implemented.
Just before BEP implementation began in FY 1992, state and local revenues were roughly equal – each making up 50% of all school districts’ combined in-state revenues. By FY 1998, the state’s share grew to 54%, and it has stayed close to that amount ever since (Figure 2). (2) (3)
Figure 2
3. The reliance on state funding varies significantly from one district to another but has grown for most districts over time.
State dollars comprise a larger share of most districts’ revenues than two- to three- decades ago. Between 1992 and 1999, state dollars grew from about 57% of the average school district’s revenues to 64%. By 2020, they had grown to 66%. That share increased for all but 15 of the state’s 133 districts/counties during the BEP’s phase-in and for all but 38 between then and 2020 (Figure 3). [i] (6) (3)
While the average school district got 66% of its in-state revenues from state government in FY 2020, there was wide variation. The state’s share ranges from less than 25% for the Franklin special school district in Williamson County to nearly 90% for the Alamo city school district in Crockett County (Figure 4). (3)
Figure 3
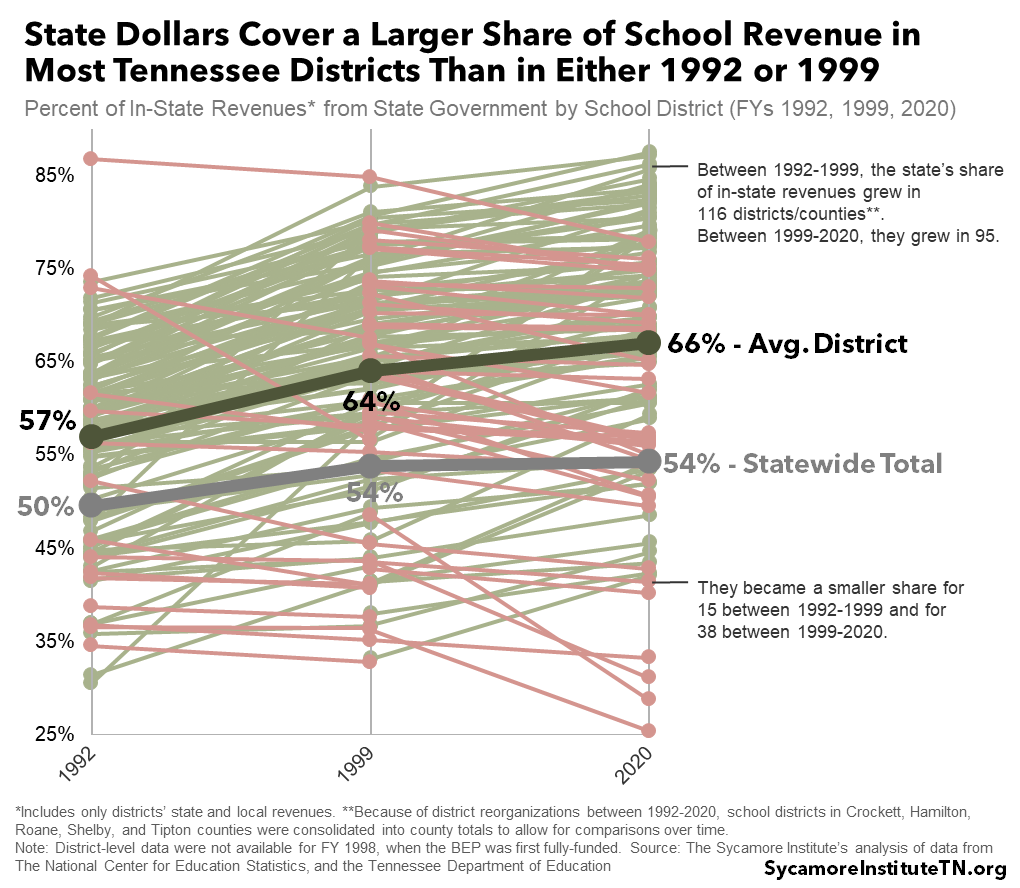
Figure 4
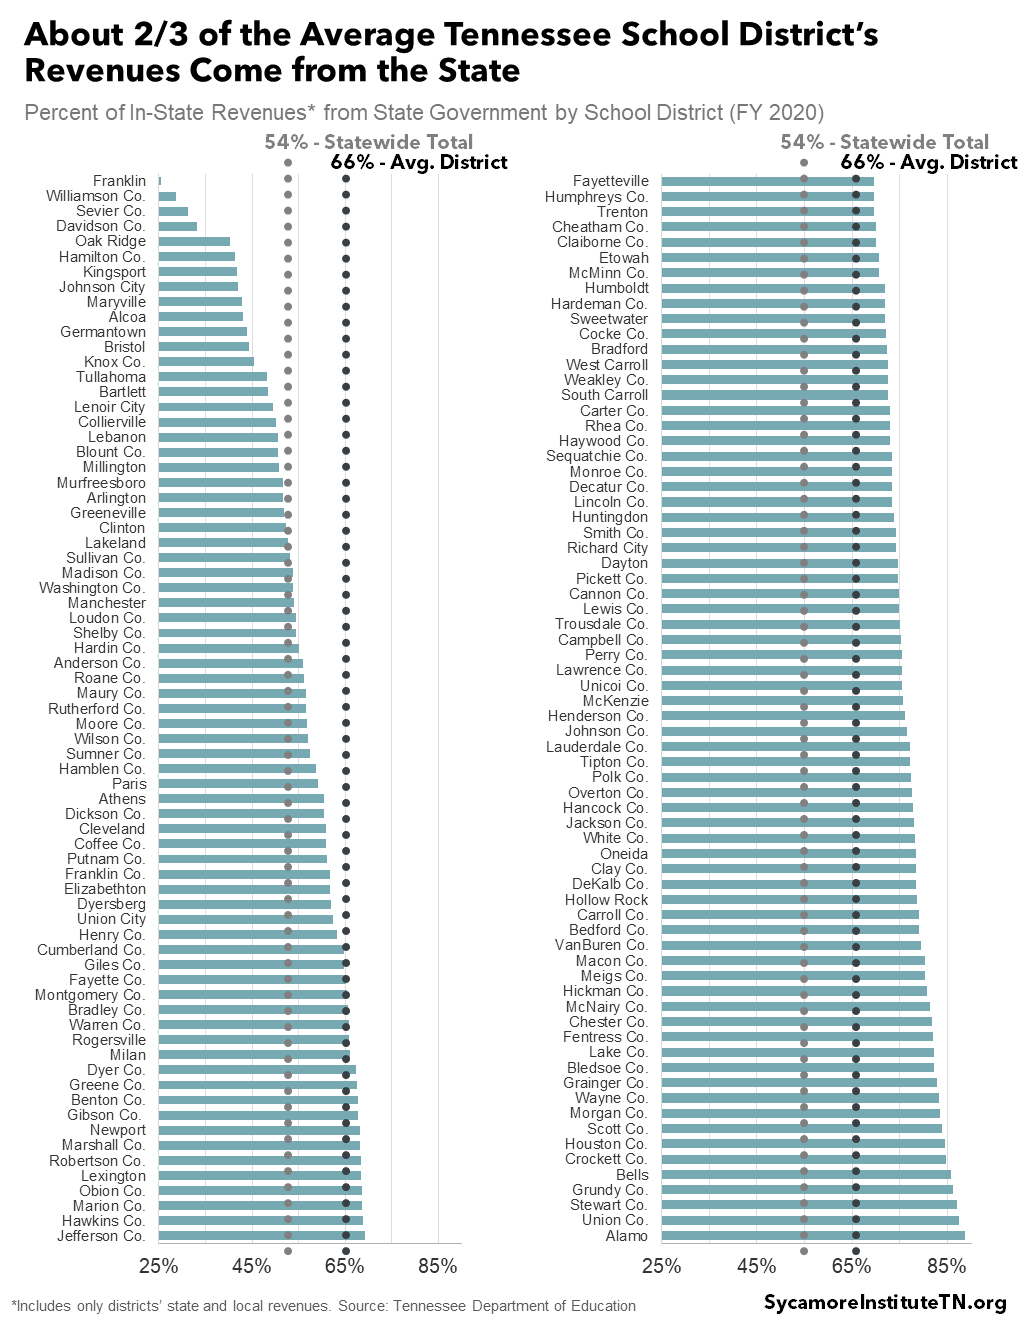
Chart Note
In Figures 2-4, “statewide total” means the state government’s share of all school districts’ combined in-state revenues. “Average district” shows the average of each individual school district’s share of in-state revenues that come from state government. Figure 2 displays the breakdown of the statewide total between FYs 1992-2020. Figure 3 shows how the share of revenues from state government changed between FYs 1992-1999 and FYs 1999-2020 for each individual school district as well as the average district – with more detail on FY 2020 in Figure 4.
4. Local governments pick up a larger share of school funding than the state’s education funding formula requires.
The BEP formula calculates a combined state and local total for education spending in each district based on numerous variables and assumptions about what is necessary for a basic education. In FY 2020, the BEP formula calculated a total of $7.3 billion needed to fund schools – including 66% from the state and 34% from local governments. (7) In fact, school districts reported over $9.5 billion of in-state revenues – including 54% from the state and 46% from local sources (Figure 5). Local revenues exceeded BEP requirements by 76%, while state revenues were over by 8%. (3)
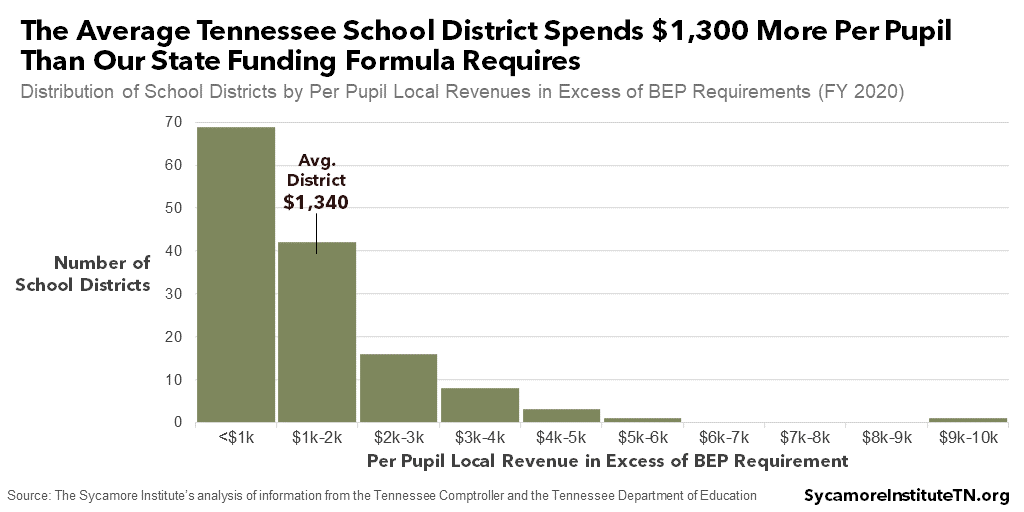
On average, school districts put up $1,300 more per pupil than required by state law. Most districts in FY 2020 contributed between $100-$2,000 per pupil above BEP requirements (Figure 6). One district – the Franklin special school district – exceeded the required amount by over $9,000 per pupil. (7) (3) (8)
Figure 5
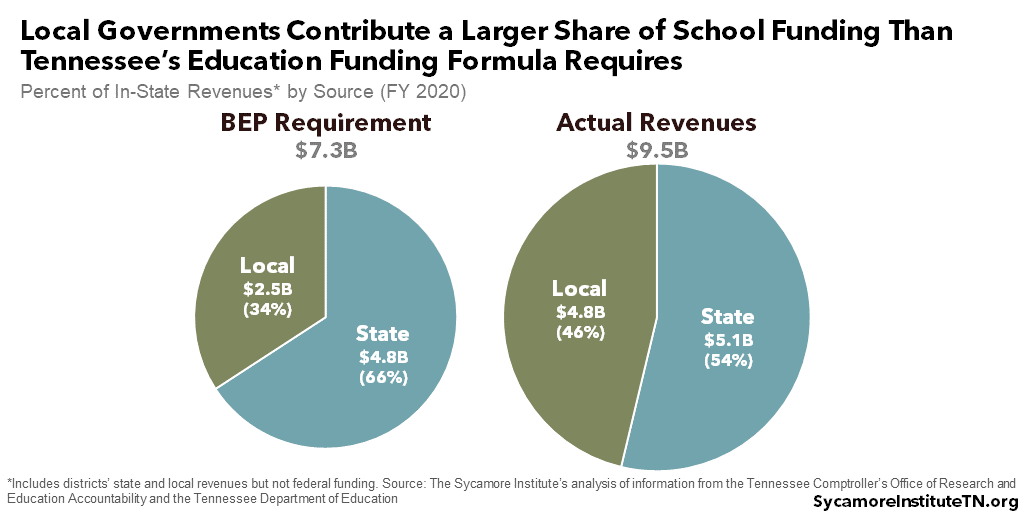
Figure 6
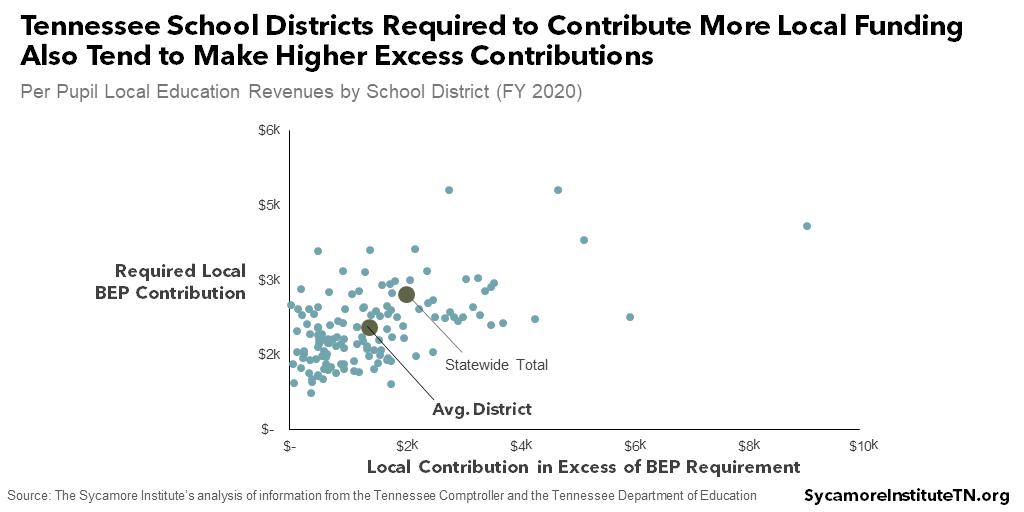
5. Districts with higher fiscal capacity must rely more on local funding, but they also tend to contribute the most in excess of BEP requirements.
School districts able to raise more local revenue (e.g. higher property values, sales tax base, etc.) are said to have more “fiscal capacity” and must generate a larger share of their total BEP calculation from local funds. At the higher end, for example, Davidson County had to cover 56% of its BEP calculation in FY 2020 from local revenues – about $4,800 per student. At the low end, the Union County school district had to pick up 9%, or about $700 per student. (7)
However, districts with the highest fiscal capacity also tend to contribute the most in excess of what the BEP requires (Figure 7). On a per student basis, for example, Union County contributed about $380 above its $700 requirement, while Davidson County contributed $4,700 on top of its required $4,800. (7) (3) (8)
Figure 7
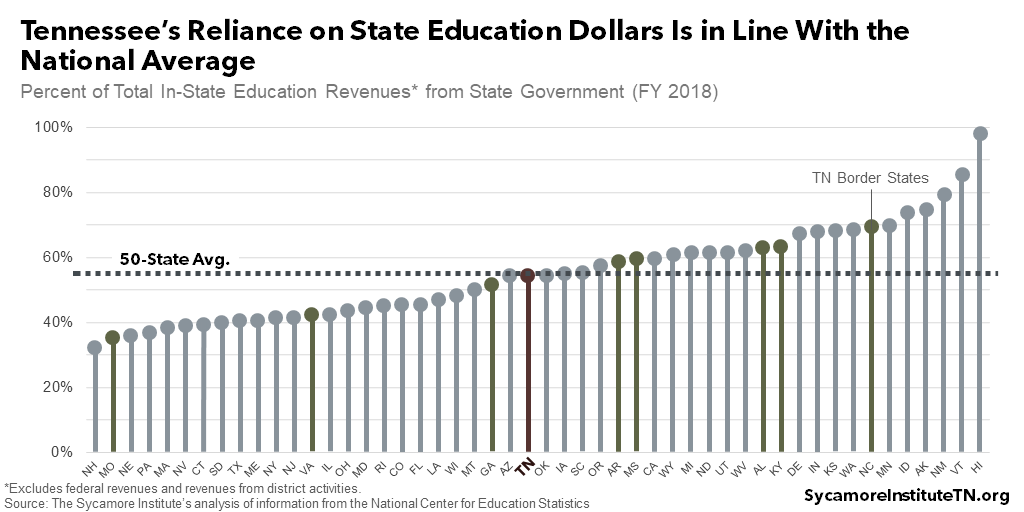
6. Tennessee’s reliance on state education dollars is in line with the national average.
Across all 50 states, an average of about 54% of in-state education revenues came from state governments in FY 2018 (the most recent year for which national data are available). Tennessee’s rate hit the average almost exactly (Figure 8). (6)
Figure 8
[i] Because of district reorganizations between 1992-2020, school districts in Crockett, Hamilton, Roane, Shelby, and Tipton counties were consolidated into county totals to allow for comparisons over time. District-level revenue data were not available for FY 1998 when the BEP was fully funded for the first time.
References
Click to Open/Close
- Tennessee Advisory Commission on Intergovernmental Relations (TACIR). K-12 Public Education Funding and Services. [Online] January 2020. https://www.tn.gov/content/dam/tn/tacir/2020publications/2020_K12Financing.pdf.
- Tennessee Department of Education. Financial Summaries – Revenue – Total from All Sources. Annual Statistical Reports for 1992-1998. [Online] 1993-1999. Data obtained from TACIR.
- —. Financial Summaries – Revenue – Total from All Sources. Annual Statistical Reports for 1999-2020. [Online] 2000-2021. Data retrieved from https://www.tn.gov/education/data/department-reports.html.
- U.S. Department of Education. State Nonfiscal Public Elementary/Secondary Education Survey Membership Data. National Center for Education Statistics Common Core of Data (CCD). [Online] 2021. Retrieved from https://nces.ed.gov/ccd/elsi/tableGenerator.aspx.
- U.S. Bureau of Economic Analysis (BEA). GDP Price Index for 1992-2020. [Online] Retrieved from https://apps.bea.gov/iTable/iTable.cfm?reqid=19&step=3&isuri=1&select_all_years=0&nipa_table_list=18&series=a&first_year=1992&last_year=2021&scale=-99&categories=survey&thetable=.
- U.S. Department of Education. Local Education Agency (School District) Finance Survey (F-33) Data for 1992-1998. National Center for Education Statistics Common Core of Data (CCD). [Online] Data accessed from https://nces.ed.gov/ccd/files.asp.
- Tennessee Comptroller of the Treasury. FY 2020 BEP Calculator. Offices of Research and Education Accountability. [Online] Retrieved from https://comptroller.tn.gov/office-functions/research-and-education-accountability/interactive-tools/bep.html.
- Tennessee Department of Education. Statistical Summaries – Average Daily Membership. Annual Statistical Report for 2020. [Online] 2021. Data Retrieved from https://www.tn.gov/education/data/department-reports/2020-annual-statistical-report.html.