Organic Nitrogen Compounds IX: Urethanes and Diisocyanates
Here we delve into the interpretation of another organic nitrogen compound, known as polyurethane, a ubiquitous polymer used for wood finishes and foam rubber.
The urethane functional group is found almost exclusively in polymer form, known as polyurethanes. These ubiquitous polymers make urethanes an economically important functional group. Urethanes are made using diisocyanates. How to identify diisocyanates, and distinguishing among different urethane types using infrared spectroscopy, are explained in this installment of the column.
The urethane functional group is found almost exclusively in polymer form, known as polyurethanes. These ubiquitous polymers are used as wood finishes and make up polyurethane foam, also known as foam rubber. The structural framework of a urethane is shown in Figure 1.


Figure 1: The structural framework of a secondary urethane.
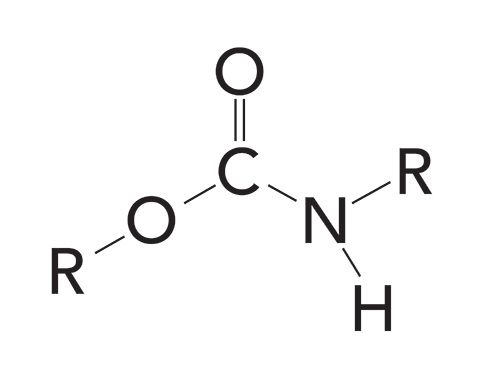
Note that this functional group contains a carbonyl bond with an oxygen atom and nitrogen atom attached to it. The latter is why urethanes are included in this series on organic nitrogen compounds. On the left-hand side of Figure 1, the urethane looks like an ester because of the O-C=O linkage (1), but on the right-hand side of Figure 1, the N-C=O linkage looks like an amide (2,3). As we will see, the infrared spectra of urethanes combine features of both esters and amides.
Like amides, urethanes are denoted as primary if one carbon and two hydrogens are attached to the nitrogen atom, as secondary if two carbon atoms and one hydrogen atom are attached to the nitrogen, and as tertiary if three carbon atoms are attached to the nitrogen. Figure 1 shows the structure of a secondary urethane. Note that it contains two C-N bonds and one N-H bond.
Polyurethanes are made by reacting alcohols with a functional group called a diisocyanate. The structural framework of a diisocyanate is seen in Figure 2.


Figure 2: The structural framework of the diisocyanate functional group.
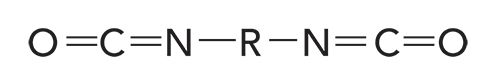
Note that a diisocyanate contains two isocyanate -N=C=O linkages, hence the “di” in the name. A molecule with one -N=C=O unit would simply be called an isocyanate. When urethanes and alcohols are polymerized to make polyurethanes, there can be isocyanate end groups that occasionally appear in the spectra
of polyurethanes.
The Infrared Spectra of Diisocyanates
The infrared spectrum of a diisocyanate is shown in Figure 3.


Figure 3: The infrared spectrum of a diisocyanate.
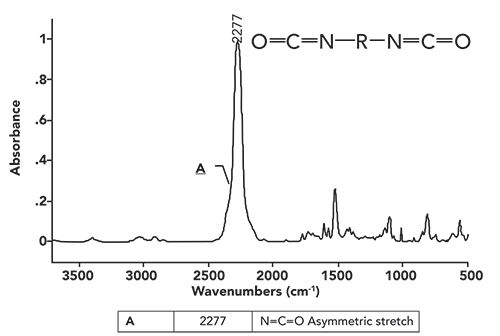
Note that the spectrum is dominated by the peak labeled A at 2277 cm-1 (assume all peak positions are in wavenumbers going forward, even if not labeled as such). This peak is due to the asymmetric stretch of the -N=C=O group, which normally falls from 2280 to 2240. This peak is the perfect example of a group wavenumber, because it is intense and shows up in a part of the spectrum where very few other functional groups absorb (5). Throughout the over 30 installments of this column, you may have noticed that most of the time we focus our attention from 3500 to 2800, and from 2000 to 400. That is because very few functional groups absorb between 2800 and 2000. The only other infrared peak we have seen that absorbs near diisocyanates is the C≡C stretch of disubstituted alkynes, which fall from 2260 to 2190 (6). These two functional groups are easily distinguished, because the diisocyanate -N=C=O asymmetric stretching peak is broader and stronger than a typical C≡C stretch. This is because of the high polarity of the -N=C=O group compared to that of an alkyne triple bond (7). The strength and unusual position of the -N=C=O stretching peak are why it sometimes appears in polyurethane spectra, even though it is in low concentration.
The Infrared Spectra of Urethanes
Based on the structural framework of urethanes shown in Figure 1, we can predict to a point what urethane spectra will look like. Primary and secondary urethanes contain N-H bonds, and so have N-H stretches that are medium in width and intensity, and fall in the same wavenumber range as the N-H stretching peaks of amides and amines (2–4). The C=O bond in urethanes means there should be a strong C=O stretching peak (8) from around 1700, and the C-O bond means there should be a strong peak between 1300 and 1000 (9).
The infrared spectra of primary urethanes behave as expected. Their asymmetric and symmetric NH2 stretches are found from 3450 to 3400 and 3240 to 3200, respectively. Primary urethanes have two NH stretching peaks, as do primary amines and amides (2–4), because, in all these cases, the primary nitrogen contains two N-H bonds, hence two N-H stretching peaks (3). The carbonyl stretch of primary urethanes falls at 1740 to 1730, and there is an NH2 scissors (in-plane bending) peak from 1630 to 1610.
Unfortunately, the C=O stretching peak of primary urethanes falls in the same region as other carbonyl-containing functional groups, such as ketones, aldehydes, esters, and carboxylic acids (8,9). However, these functional groups do not contain nitrogen, hence there are no N-H stretching peaks, making distinguishing primary urethanes from these compounds easy. But primary amides have two NH2 stretches, and a C=O stretch (3), as do primary urethanes. Fortunately, the primary urethane C=O stretch is at 1740 to 1730, whereas, for primary amides, it falls from 1680 to 1630 (10). This difference in C=O stretching peak position means primary amides and urethanes can be distinguished from each other. The diagnostic group wavenumber pattern, then, for primary urethanes is two NH stretching peaks, a C=O peak around 1730, and an NH2 scissors peak.
The infrared spectrum of a secondary urethane, a “polyurethane/polyether foam,” better known as foam rubber, is seen in Figure 4.


Figure 4: The infrared spectrum of a polyurethane/polyether foam.
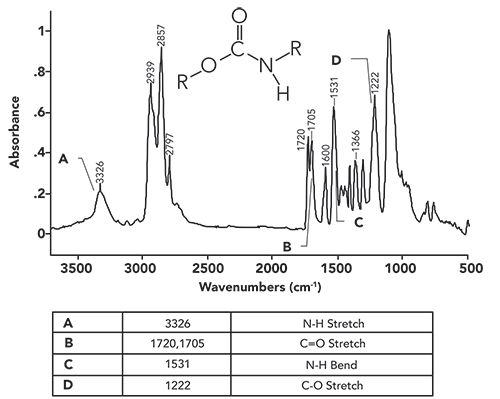
Because this polymer is a secondary urethane, as seen in the figure, it has a single N-H bond, and, hence, a secondary nitrogen. The spectral signature of a secondary nitrogen, as we saw for secondary amides and amines (2–4), is a single N-H stretching peak. In Figure 4, this peak is labeled A at 3326. In general, for secondary urethanes, this peak falls from 3340 to 3250. Note that the NH stretching peak in Figure 4 is of medium intensity and height, consistent with many of the other NH stretches we have seen (11).
The carbonyl stretch in Figure 4 labeled B is split, with peaks at 1720 and 1705. In the past, a double carbonyl stretch like this indicated the presence of two separate carbonyl bonds in a functional group, such as for acid anhydrides (12) and imides (13). However, this is clearly not the case here; urethanes do not contain two carbonyl bonds. The cause of this split carbonyl peak is that some urethane C=O groups engage in hydrogen bonding, whereas others don’t. The 1720 peak is from non-hydrogen bonded, or “unassociated,” carbonyls, whereas the 1705 peak is from the hydrogen bonded, or “associated,” carbonyl groups (10). We have already studied the effects of hydrogen bonding on peaks, such as for alcohols (9). The tendency for peaks upon hydrogen bonding is to broaden and move to lower wavenumbers, as we have seen here.
The peak labeled C in Figure 4 at 1531 is the in-plane N-H bend of a secondary urethane. In general, this peak falls from 1540 to 1520. Secondary amides also have a peak from the same vibration in the same place (3). However, secondary amide C=O stretches fall from 1680 to 1630, whereas, for secondary urethanes, this peak falls from 1740 to 1705, higher than in secondary amides, allowing us to distinguish between secondary urethanes and amides.
The diagnostic group wavenumber pattern then for secondary urethanes is a single N-H stretch, a carbonyl stretch from 1740 to 1705, and an N-H in-plane bend from 1540 to 1520. Primary and secondary urethanes can be distinguished, because the former has two NH stretching peaks, whereas the latter has one.
A further examination of Figure 1 shows that urethanes have a C-O bond, and we have learned in general that C-O stretching peaks are intense and fall from 1300 to 1000 (9). The peak labeled D at 1222 in Figure 4 is a urethane C-O stretch. The C-O stretch for all urethanes falls from 1250 to 1200 (10). There is a large peak at ~1050 in Figure 4 that is not labeled. It is from the C-O stretch of the ether groups (14)in this particular polyurethane/polyether foam.
Tertiary urethanes contain no NH bonds, hence they have no NH stretching or bending peaks. Their only useful group wavenumber is their C=O stretch from 1690 to 1680 (10), which also overlaps with amides. Thus, tertiary urethanes, like tertiary amines and amides (2–4) are a functional group that is hard to distinguish by infrared
spectroscopy.
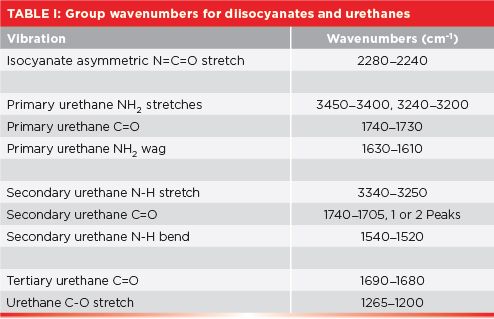
A summary of the group wavenumbers discussed in this column is seen in Table I.


Conclusions
Urethanes are often made into polyurethanes by reaction with diisocyanates. Diisocyanates have a strong and uniquely positioned -N=C=O asymmetric stretching peak from 2280 to 2240. Like amides and amines, urethanes can be classified as primary, secondary, and tertiary, based on the number of C-N and N-H bonds. Primary urethanes exhibit two NH stretches, a C=O stretch, and an NH2 scissoring vibration. Secondary urethanes have one NH stretch, a C=O stretch, and an NH in plane bend. Tertiary urethanes are difficult to discern by infrared spectroscopy.
References
- B.C. Smith, Spectroscopy 33(7), 20–23 (2018).
- B.C. Smith, Spectroscopy34(11), 30–33 (2019).
- B.C. Smith, Spectroscopy35(1), 10–15 (2020).
- B.C. Smith, Spectroscopy34(3), 22–25 (2019).
- B.C. Smith, Spectroscopy31(1), 14–21 (2016).
- B.C. Smith, Spectroscopy32(7), 18–24 (2017).
- B.C. Smith, Spectroscopy 30(1), 16–23 (2015).
- B.C. Smith, Spectroscopy32(9), 31–36 (2017).
- B.C. Smith, Spectroscopy32(1), 14–21 (2017).
- G. Socrates, Infrared and Raman Characteristic Group Frequencies (Wiley, New York, New York, 3rd Ed., 2001).
- B.C. Smith, Spectroscopy34(1), 10–15 (2019).
- B.C. Smith, Spectroscopy33(3), 16–20 (2018).
- B.C. Smith, Spectroscopy35(3), 26–30 (2020).
- B.C. Smith, Spectroscopy32(5), 22–26 (2017).
- B.C. Smith, Spectroscopy 31(11), 28–34 (2016).
- B.C. Smith, Spectroscopy 31(3), 34–37 (2016).
Solution to the Last Infrared Spectral Interpretation Challenge
The spectrum from the last interpretation challenge is seen in Figure i.


Figure i: The infrared spectrum of a fiber.
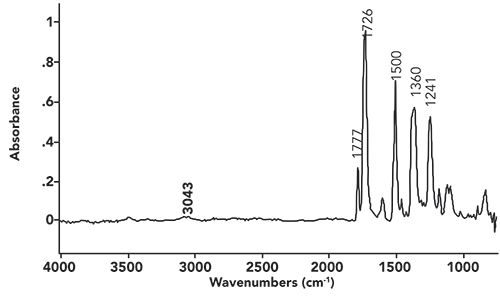
As we work our way from left to right across this spectrum, the first peak we encounter is at 3043. We have learned that peaks between 3100 and 3000 are typically the C-H stretch of unsaturated carbons (15). However, this peak by itself cannot help us distinguish between the two most common unsaturated carbon types, alkenes or benzene rings. Alkenes have a C=C stretching peak from 1680 to 1630 (15), but, given that there are no peaks in this region in this spectrum, we can rule out an alkene. Benzene rings have ring mode peaks that are sharp, and appear from 1630 to 1400 (16). The sharp peak at 1500 can be assigned as a ring mode, indicating we have a benzene ring present.
The most notable feature in Figure i is the pair of peaks at 1777 and 1726. Given their position and intensity, they are C=O stretching vibrations (8). The fact that there are two carbonyl stretching peaks indicates there may be a functional group present with two C=O bonds in it. Acid anhydrides are a possibility here, because we have seen that their spectra possess a double carbonyl stretching peak (12). However, the acid anhydride functional group also contains a C-O bond, and, hence, should have a strong C-O stretching peak between 1060 and 1035. There are no strong peaks in this region, meaning this is not an acid anhydride.
We saw last time (13) that cyclic imides have a double carbonyl stretch with peaks at 1790 to 1735 and 1750 to 1680. The spectrum in Figure i has peaks at 1777 and 1726, consistent with there being a cyclic imide present.
Now, some imides have an N-H bond, and, hence, an NH stretching peak at 3200±50 (13). The absence of an NH stretch here means there is not an NH bond, but, more than likely, a C-N bond in the imide functional group. Note that the caption in Figure i says the sample is a fiber. This means the sample is a polymer, and we probably have a polyimide where the repeat units connect through the nitrogen in the imide functional group, explaining the lack of an NH stretch.
I am afraid this is as far as we can push this analysis. What we know is that we have a cyclic aromatic polyimide. The most common material fitting this description has the trade name Kapton, or the chemical name poly(4,4’-oxydiphenylene-pyromellitimide). Given this name, you can see why we will simply call this material Kapton. The chemical structure of Kapton is seen in Figure ii.


Figure ii: The chemical structure of Kapton, the answer to this Interpretation Challenge.
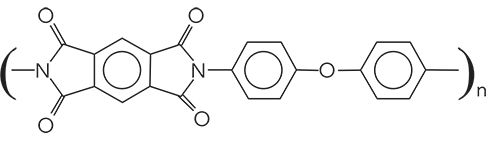
Note there is also an aromatic ether in this structure, hence the C-O stretch in Figure i at 1241 (14).


Brian C. Smith, PhD, is the founder and CEO of Big Sur Scientific, a maker of portable mid-infrared cannabis analyzers. He has over 30 years experience as an industrial infrared spectroscopist, has published numerous peer reviewed papers, and has written three books on spectroscopy. As a trainer, he has helped thousands of people around the world improve their infrared analyses. In addition to writing for Spectroscopy, Dr. Smith writes a regular column for its sister publication Cannabis Science and Technology and sits on its editorial board. He earned his PhD in physical chemistry from Dartmouth College. He can be reached at: SpectroscopyEdit@MMHGroup.com â


")


Infrared Spectroscopy of Polymers XII: Polyaramids and Slip Agents
May 1st 2023Slip agents are commonly used amide small molecules that lubricate the molds in injection molding processes. By studying the spectra of a primary amide, we can see how they can contaminate the spectra of polymeric materials.


