Housing starts rose strongly in June, above 1.6 million units. As construction picks up, housing inventory has also modestly improved in the last several months. The National Association of REALTORS® estimates that there are about 1.25 million units available for sale as of the end of June, up 3.3% from May. With more homes available on the market, homebuying activity rose in June after falling for four consecutive months. This shows that the recent slowdown in housing activity occurred due to limited inventory even though demand was very strong. Nevertheless, with the pandemic and favorable demographics intensifying the demand for housing even further, we need to build more homes.
The National Association of REALTORS® tracks the number of building permits issued by metro area every month and identifies the top 10 markets with the most and least single-family building permits issued within the last 12 months. The purpose of this blog series is to identify where housing construction is rising and where we need to address the issue of underbuilding at the local level.
Along with housing starts, building permits are also a leading indicator of housing activity for the upcoming months at local levels. Specifically, building permits provide an estimate of the number of new housing units that have been authorized by the government. In June, nearly 50% of the tracked metro areas issued more single-family building permits than the historical average.
While most of single-family homes are built in the South, the Houston and Dallas metro areas in Texas issued more than 50,000 single-family permits within the last 12 months ending in June. Given that it usually takes 10 to 12 months to build a single-family home, more than 50,000 new single-family homes have already been added or will be added to each of these markets in the following months. These new homes will help meet the increased demand, since about 140,000 and 200,000 new jobs were created during the same timeframe in Houston and Dallas metro areas, respectively.
The current analysis includes data for 262 metropolitan areas across the country. See the top 10 metro areas issuing the most single-family building permits :below
Areas with the most single-family building permits in absolute values (during July/2020 – June/2021):
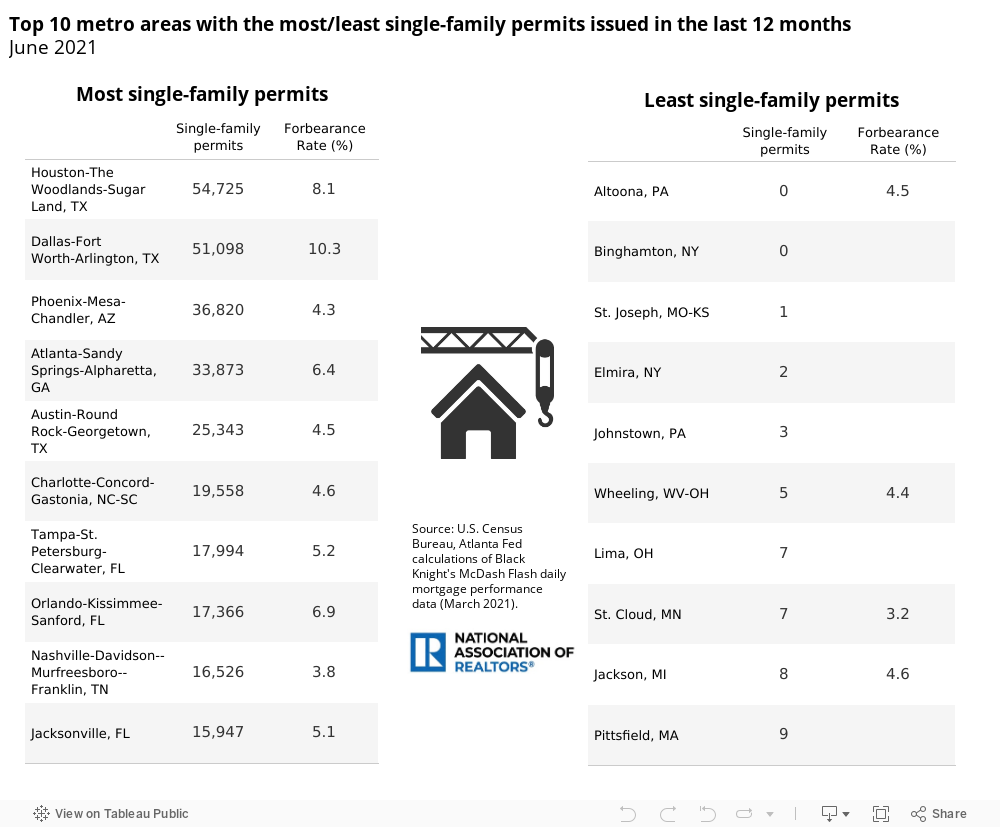
In the meantime, several federal aid programs will expire soon. The foreclosure moratorium, which prevents foreclosures of federally-backed mortgages, will expire at the end of July while the mortgage forbearance program, which allows borrowers to pause or reduce their payments, will also lapse at the end of September. Although the number of mortgages in forbearance continues to fall, there are still nearly 2 million homeowners in the forbearance program, according to Black Knight Financial Technology Solutions, LLC. Therefore, these homeowners will need to resume their mortgage payments very soon. Homeowners who are still facing financial hardships such that they cannot make their payments should have in mind that they have accumulated a substantial amount in equity that could save them from a foreclosure. For instance, in the last decade, the typical homeowner accumulated more than $120,000 in equity due to price appreciation. Thus, they could sell their home. But what does this mean for the real estate market? To put it simply, housing inventory may increase further in the following months with some of these homeowners selling their homes. It’s noteworthy to mention that most of the metro areas with the most single-family permits also had a higher forbearance rate than the national level (4%1). For example, the Dallas metro area issued about 51,100 single-family permits in the last 12 months while 10.3%2 of the active mortgages were in the forbearance program as of March 2021. Respectively, 8.1%3 of the mortgages were in the forbearance program in the Houston metro area. Thus, expect inventory to rise even further in these areas providing more opportunities to would-be homebuyers.
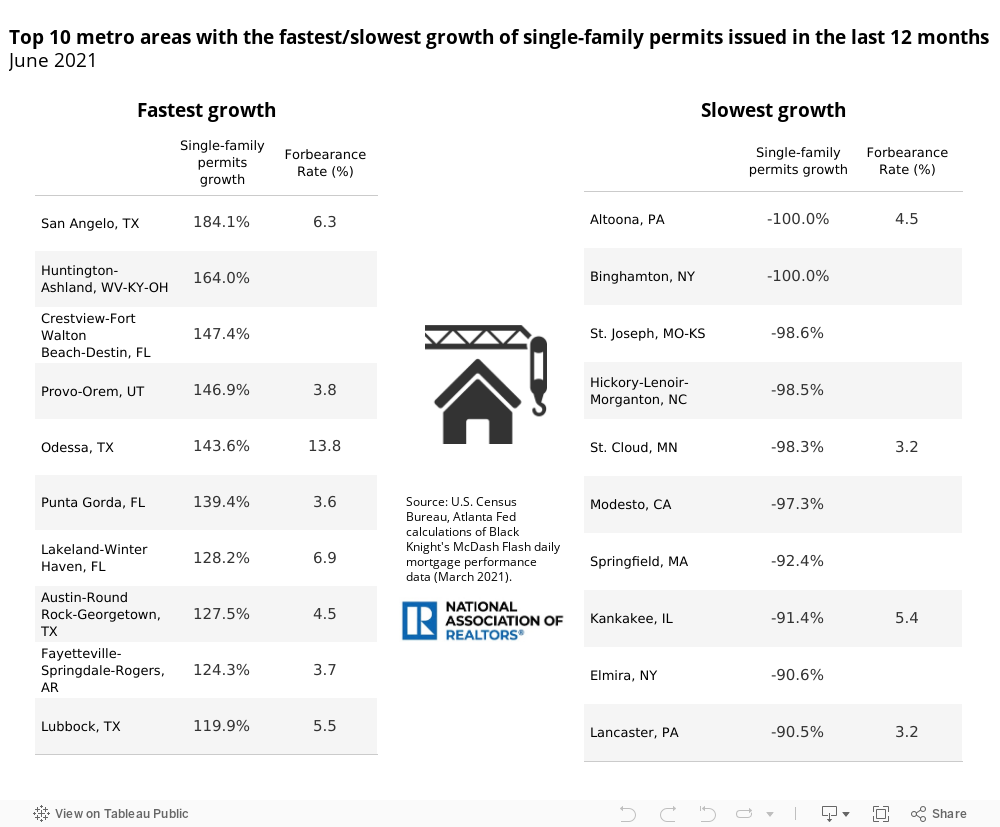
We also identified the areas with the fastest/slowest growth of single-family permits. The year-over-year comparisons may look much higher due to the "base effect" from the last year, so we compared with the 12-month average for the last 20 years of single-family building permits. We are seeing that most of the areas experiencing the most gains in single-family building permits were also located in Texas and Florida. While the Austin metro area was one of the areas with the most single-family building permits (25,340 permits in the last 12 months), this area is currently building 130% more than the historical average (11,140). This translates to great opportunities for homebuyers since a single-family permit is issued for every 3 new jobs in this area, the ratio of a balanced market.
In the areas below, the number of single-family building permits is more than twice the number of single-family building permits in the last 20 years.
Areas with the fastest/slowest growth of single-family building permits:
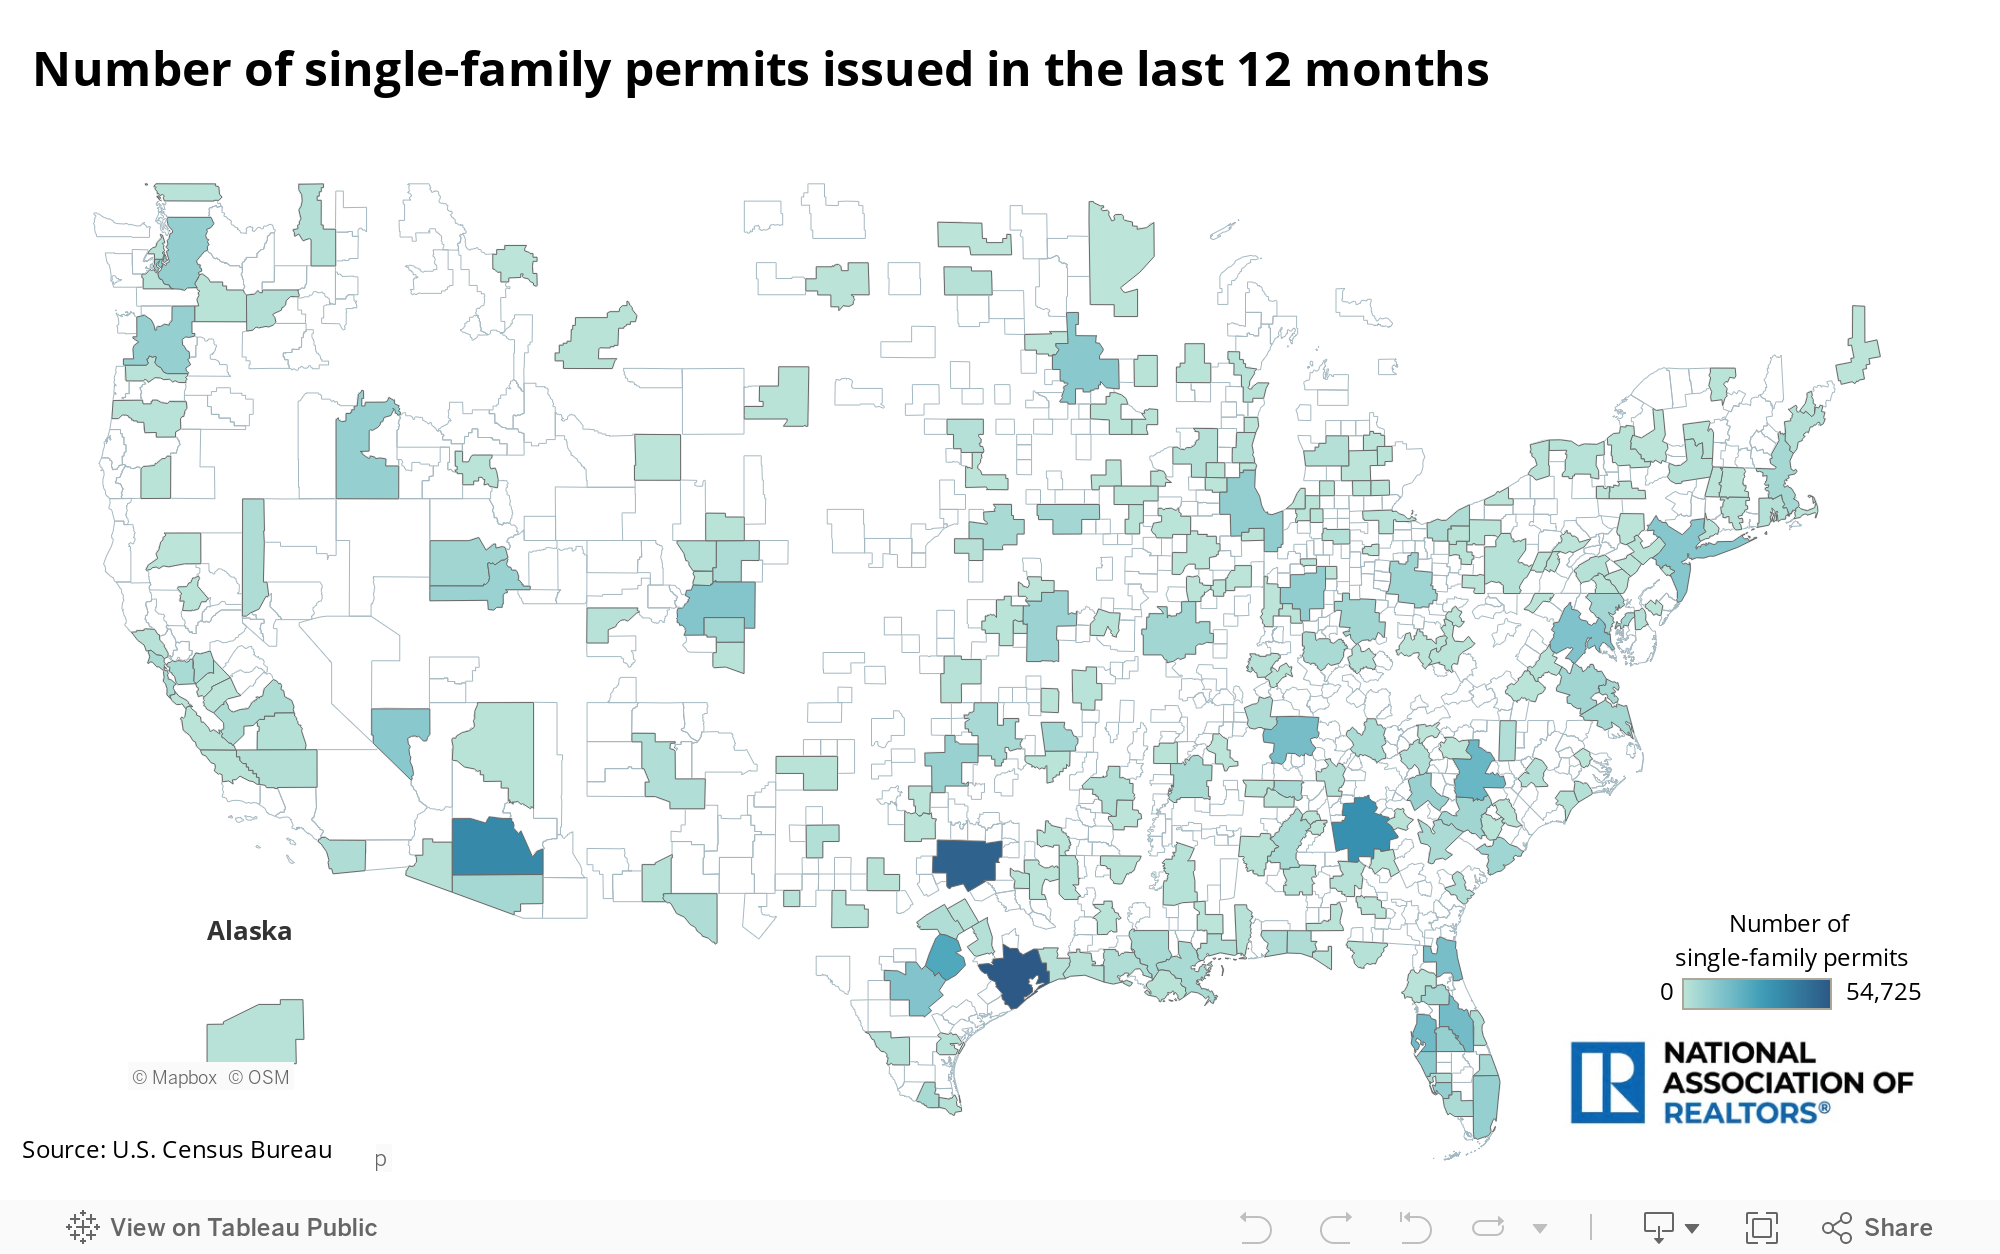
Hover over the map below to see how many single-family building permits were issued in the last 12 months in 262 metro areas across the country.
1 Black Knight Mortgage Monitor (May 2021)
2, 3 Atlanta Fed calculations of Black Knight's McDash Flash daily mortgage performance data (March 2021)