EVM Explained – Earned Value Management
Most comprehensive project management systems make use of the traditional planned vs. actual model to track how well (or not so well) the project is doing from a financial perspective. However, it does leave one important element of the picture unexposed; the value of the work achieved so far.
When planned vs. actual are the only values you’re tracking, you can only see over or under spending. It tells you little about the progress you are making. For example, you could be overspending because you’re way ahead of the plan and have made tremendous progress. So what looks like a problem could be a blessing because you’ll finish early and likely on or under budget.
However, if there is no system in place for assigning value to your achievements, you have no easy way to see what the real implications of the overspend are. Sure you can look at the schedule for a summary of project percent complete, but this percentage value alone doesn’t easily tie in to the time-phased dollar based values of the budget and actual costs you’re tracking.
To over-simplify the concept of earned value, it could be said that you’re assigning value to the progress you’ve made based upon a time-phased budget.
To illustrate the point, let’s look at a project in terms of planned vs. actual and then add earned value to see what the extra dimension reveals.
EVM Explained
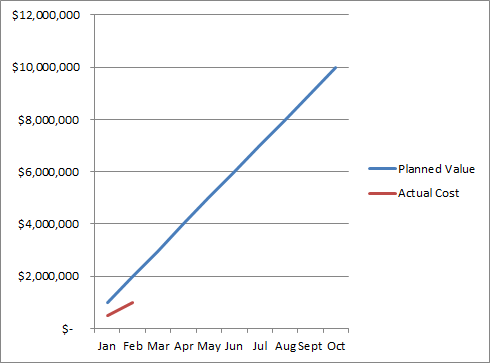
This is a 10 month project that is planned to spend $1M per month for a total budget at completion (BAC) of $10M. The project is 2 months along and according to the planned vs. actual cost figures is underspent by 50%. We could assume therefore that the project is doing well because it’s costing less than planned.
Introduce the earned value figures based upon the actual progress of the project and a new perspective is gained. After 2 months of work, only 5% of the work has been completed. The simple calculation for this scenario is 5% of the total $10M budget, which is $500K. That is the earned value figure.
Now what does this earned value figure tell us about the present situation for this project?
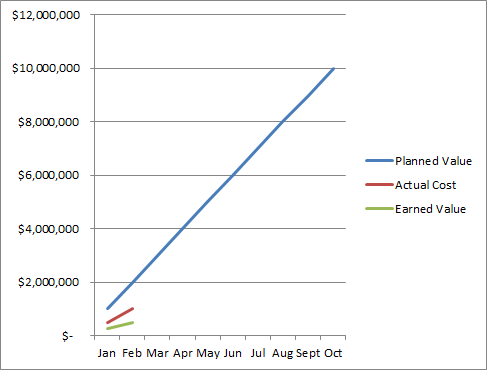
The under spending is not good news because the schedule is 75% behind; the project is actually overspending based upon the work achieved. What looked OK from a planned vs. actual perspective is very far from OK once the value of progress is introduced as earned value.
This also means you can see the impact to this project using the following standard earned value calculations. It underlines just how much trouble this project might be in.
Budget at Completion: $10M
Planned Value to date: $2M
Earned Value to date: $0.5M
Actual Cost to date: $1M
Cost Variance: (earned value – actual cost) = $-0.5M (that’s a 100% over spend)
Schedule Variance: (earned value – planned value) = $-1.5 (1.5 months or 75% behind schedule)
Cost Performance Index: (earned value / actual cost) = 0.5 (for every dollar spent you earned 50 cents)
Schedule Performance Index: (earned value / planned value) = 0.25
Estimate at Completion: (budget at completion / cost performance index) = $20M
Estimate to Completion: (budget at completion – earned value)/cost performance index = $19M
Time to complete = (10-0.5)/0.25 = 38 months
Based upon current performance this project will take a total of $20M (19+1) and 40 (38+2) months to complete.
While this is an exaggerated example, many projects suffer from some level of under spending and under performance in the early stages. This is typically because it took longer than expected to get all the right people in place, equipment delivered and everyone into a good rhythm with the workload. Without earned value management in place however, the potential impact of these early delays may go unnoticed. Management may not react appropriately or early enough to the trend in order to prevent a more long term threat to the overall success of the project.
To read more industry articles click here