Most people, if they think about geographic information systems (GIS) at all, will think of a mapping system. But in housing, GIS is rapidly becoming a strategic tool, to help predict the impact of policy changes.
By inputting spatial data, such as postcodes, local authority areas or a specific location, associations can produce visual maps of housing stock in relation to administrative boundaries, such as local authority areas.
This goes beyond just maps in the traditional sense; location is integral to everything most of us now do online. By simply putting in a postcode, someone can work out a route, which shops they pass and when they open, which stations are nearby and the best train to get, for instance.
Similarly, in housing, mapping and spatial analysis have become an essential tool. Take, for instance, the local housing allowance (LHA) cap – a policy that caps customers’ housing benefit according to the size of their property and the area they live in. These areas, knowns as broad market rental areas (BRMAs), do not follow typical local authority boundaries and vary massively in size.
Rental teams need to assess the day-to-day impact of changes in benefits on their households, while development teams need to understand how affordable new homes will be.
By mapping a range of different data sources, such as LHA rates, average property prices, market rents, employment and deprivation, we can use GIS to can identify places where customers are most likely to be affected by the cap.
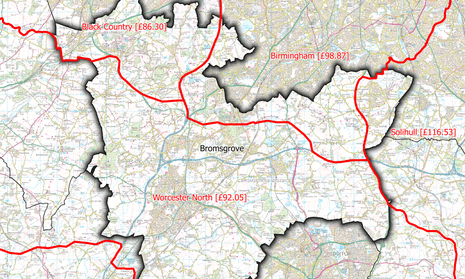
For example, the Black Country BRMA covers seven different local authorities, all of which are subject to the same LHA cap. However, it only partially covers Bromsgrove local authority, which is also subject to four other neighbouring BRMAs. This means that within a relatively small geographic area, the LHA rate for one bed homes could vary by as much as £30 a week, depending which BRMA the customer falls under. Of course, this will have significant implications on how affordable rents are. Knowing this information, and putting it into maps and graphs, means associations can providing support such as advice on money and employment for customers likely to be affected.
Without being able to map these geographies, we wouldn’t be able to quickly and accurately see this pattern and ultimately to assess the financial impact of this policy on both the business and customers.
James Jervis is research & data insight manager at Midland Heart housing association, which is a member of the Gi4Housing group.
Sign up for your free Guardian Housing network newsletter with news and analysis sent direct to you on the last Friday of the month. Follow us:@GuardianHousing
