Last week we began to dig into this year’s Key Stage 2 results, the first set since the pandemic, going beyond the headline statistics published by the Department for Education.
We tried to quantify how much things had changed.
On the one hand, the changes since 2019 did not seem to be a catastrophe. But neither were the changes trivial.
In this blogpost, we take a look at how much things have changed by region and for individual schools.
Data
As part of FFT’s 2022 Early Results service, we’ve collected Key Stage 2 results from over 2,500 primary schools. We’ve linked this to published 2019 data for those schools that were open back then.
We also look at how the distributions of test scores have changed since 2019. For this analysis, we use a smaller set of 1,500 schools which had shared 2019 data with us.
Schools
The chart below compares the percentage of pupils who achieved the expected standard in all three of reading, writing and maths in 2019 with the equivalent figure for 2022.
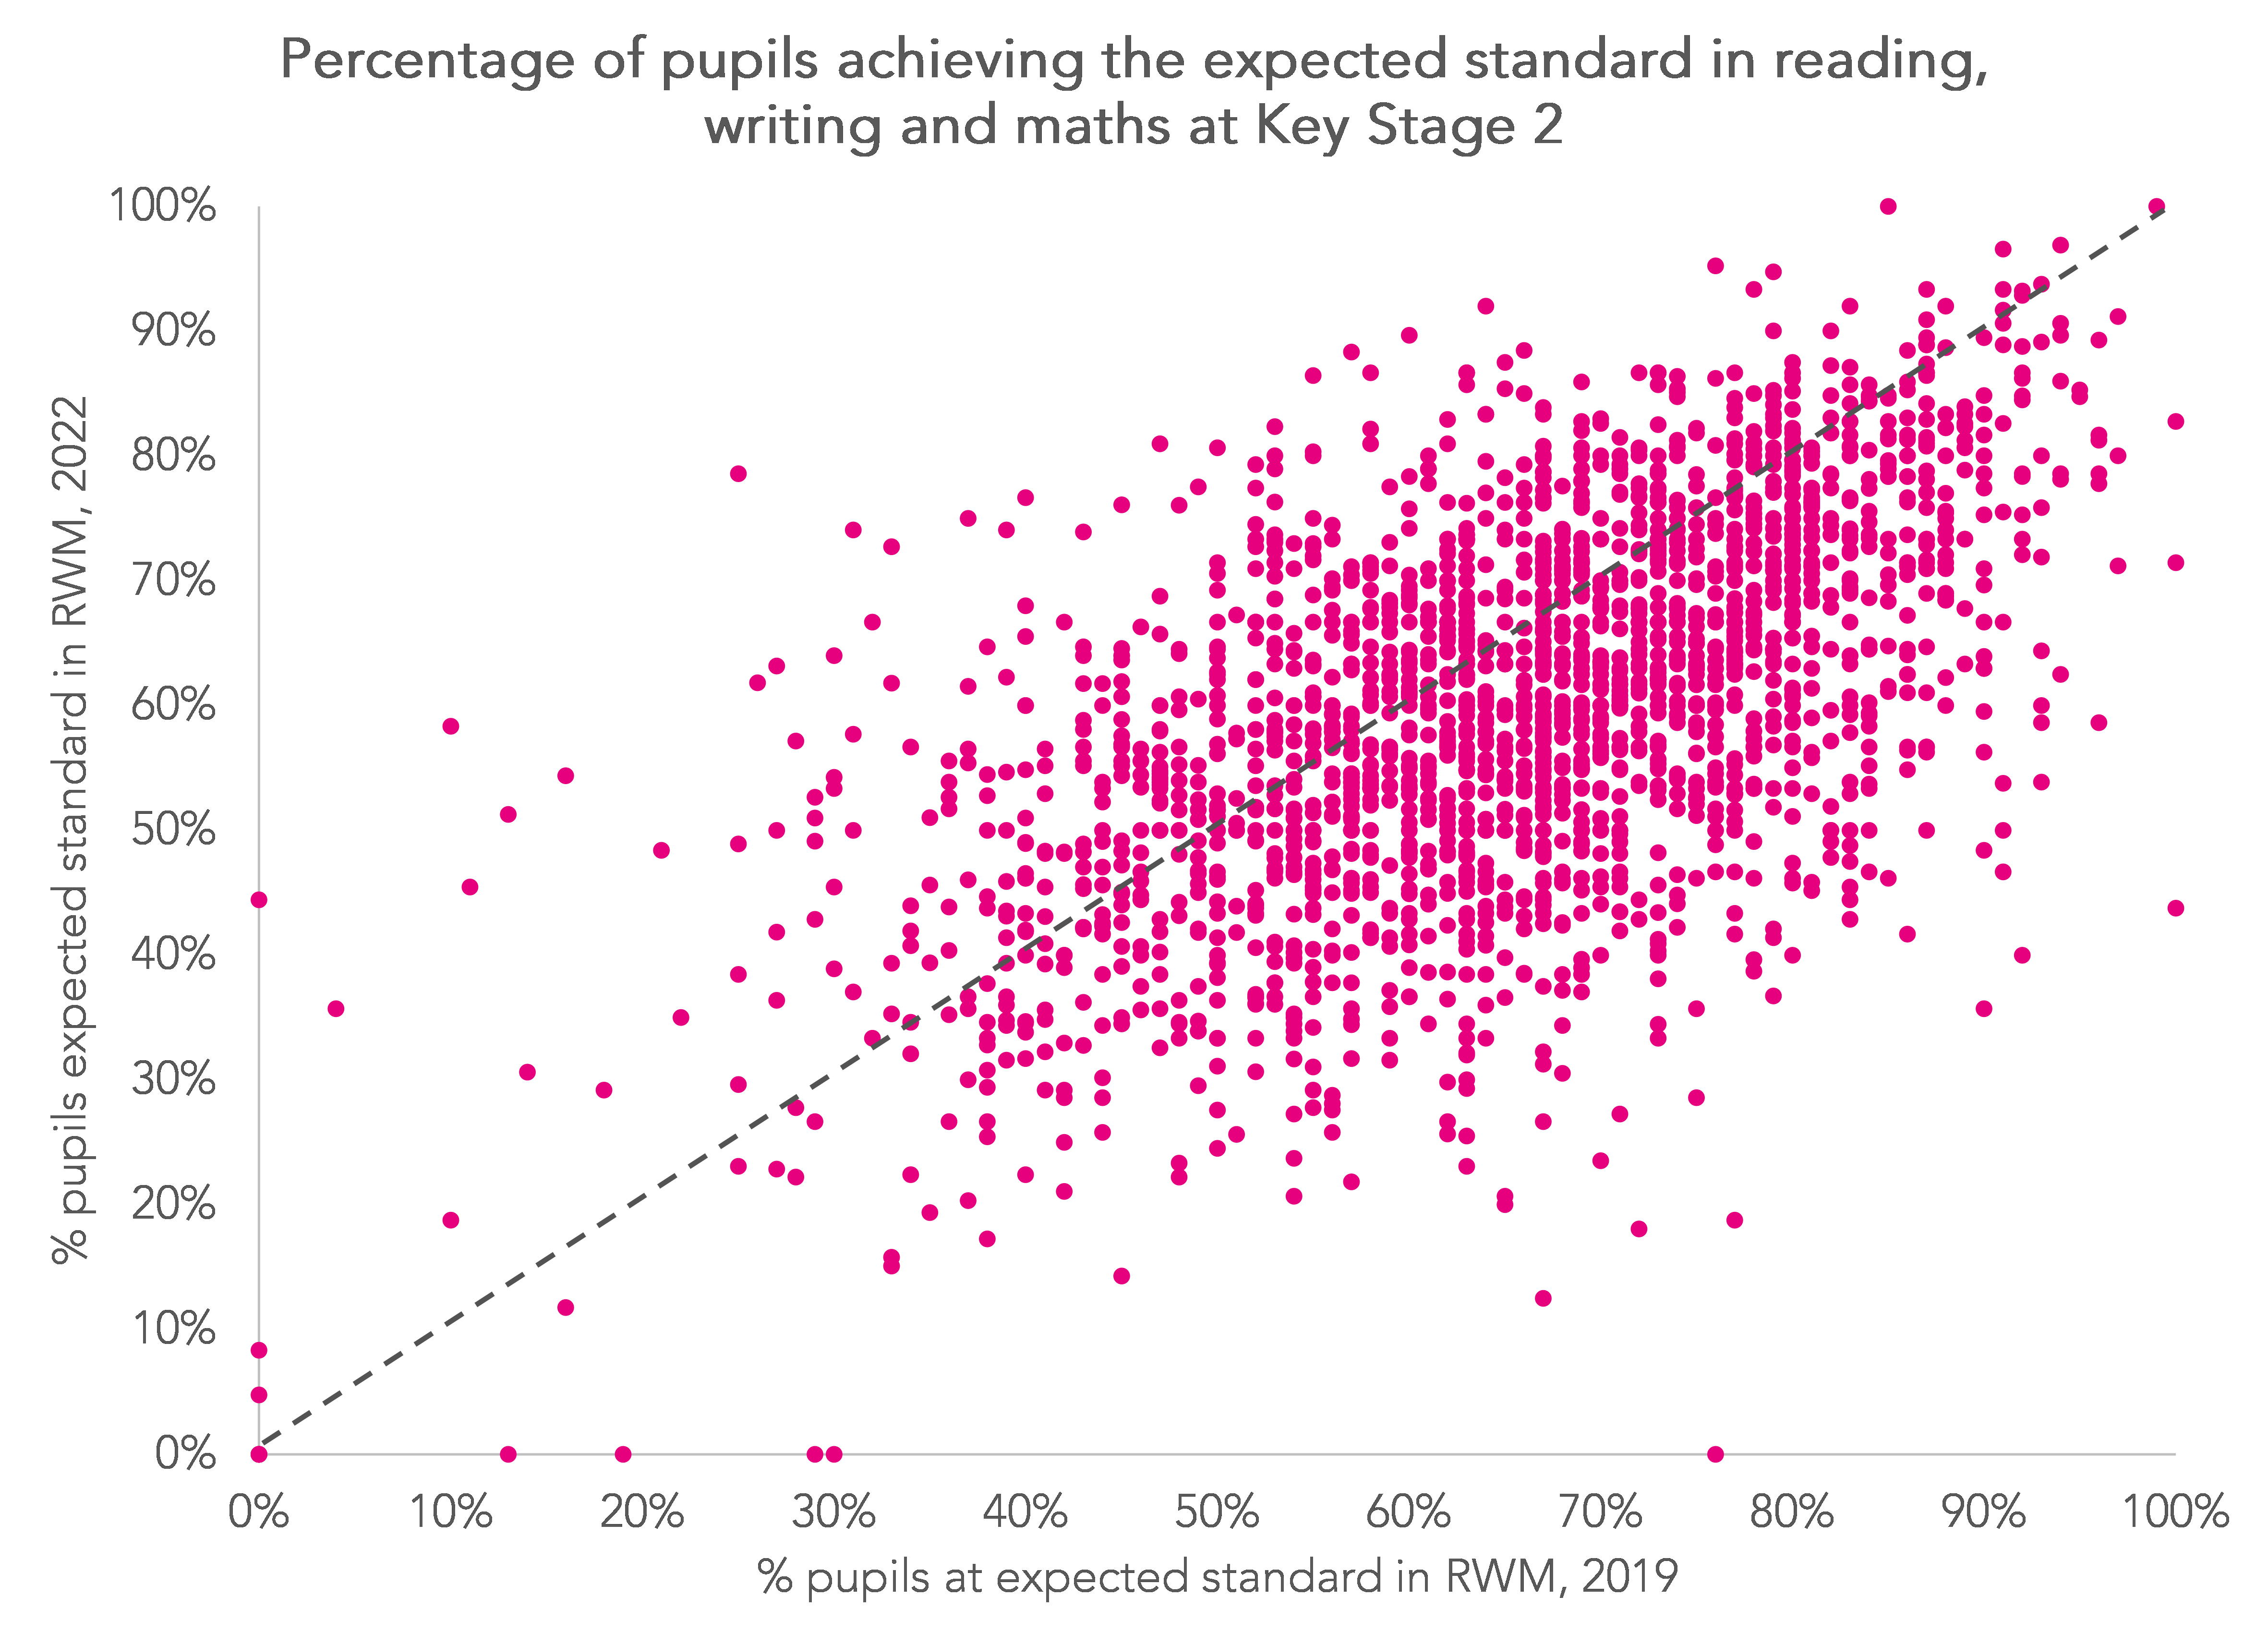
DfE statistics show that the percentage of pupils who achieved this standard nationally fell from 65% to 59%. Among our sample of schools, the respective figures were 65% and 60%.
Not all schools experienced a dip in attainment. In fact, 31% of schools are plotted above the dashed diagonal line indicating that attainment improved between 2019 and 2022.
But half of schools experienced a fall of 6 percentage points or more.
Of course, it’s perfectly normal for school-level attainment measures to vary from one year to the next, let alone over the space of three years.
However, the correlation in school figures between 2019 and 2022 (0.58) was very similar to the correlation in those for the same set of schools between 2016 and 2019 (0.54).
Before we move on, it’s worth noting that at least 90% of pupils achieved this threshold at only around 1% of schools in 2022. This underlines the scale of challenge the government has set itself in announcing a target of 90% by 2030.
Regional differences
Now let’s aggregate the school data to regional level.
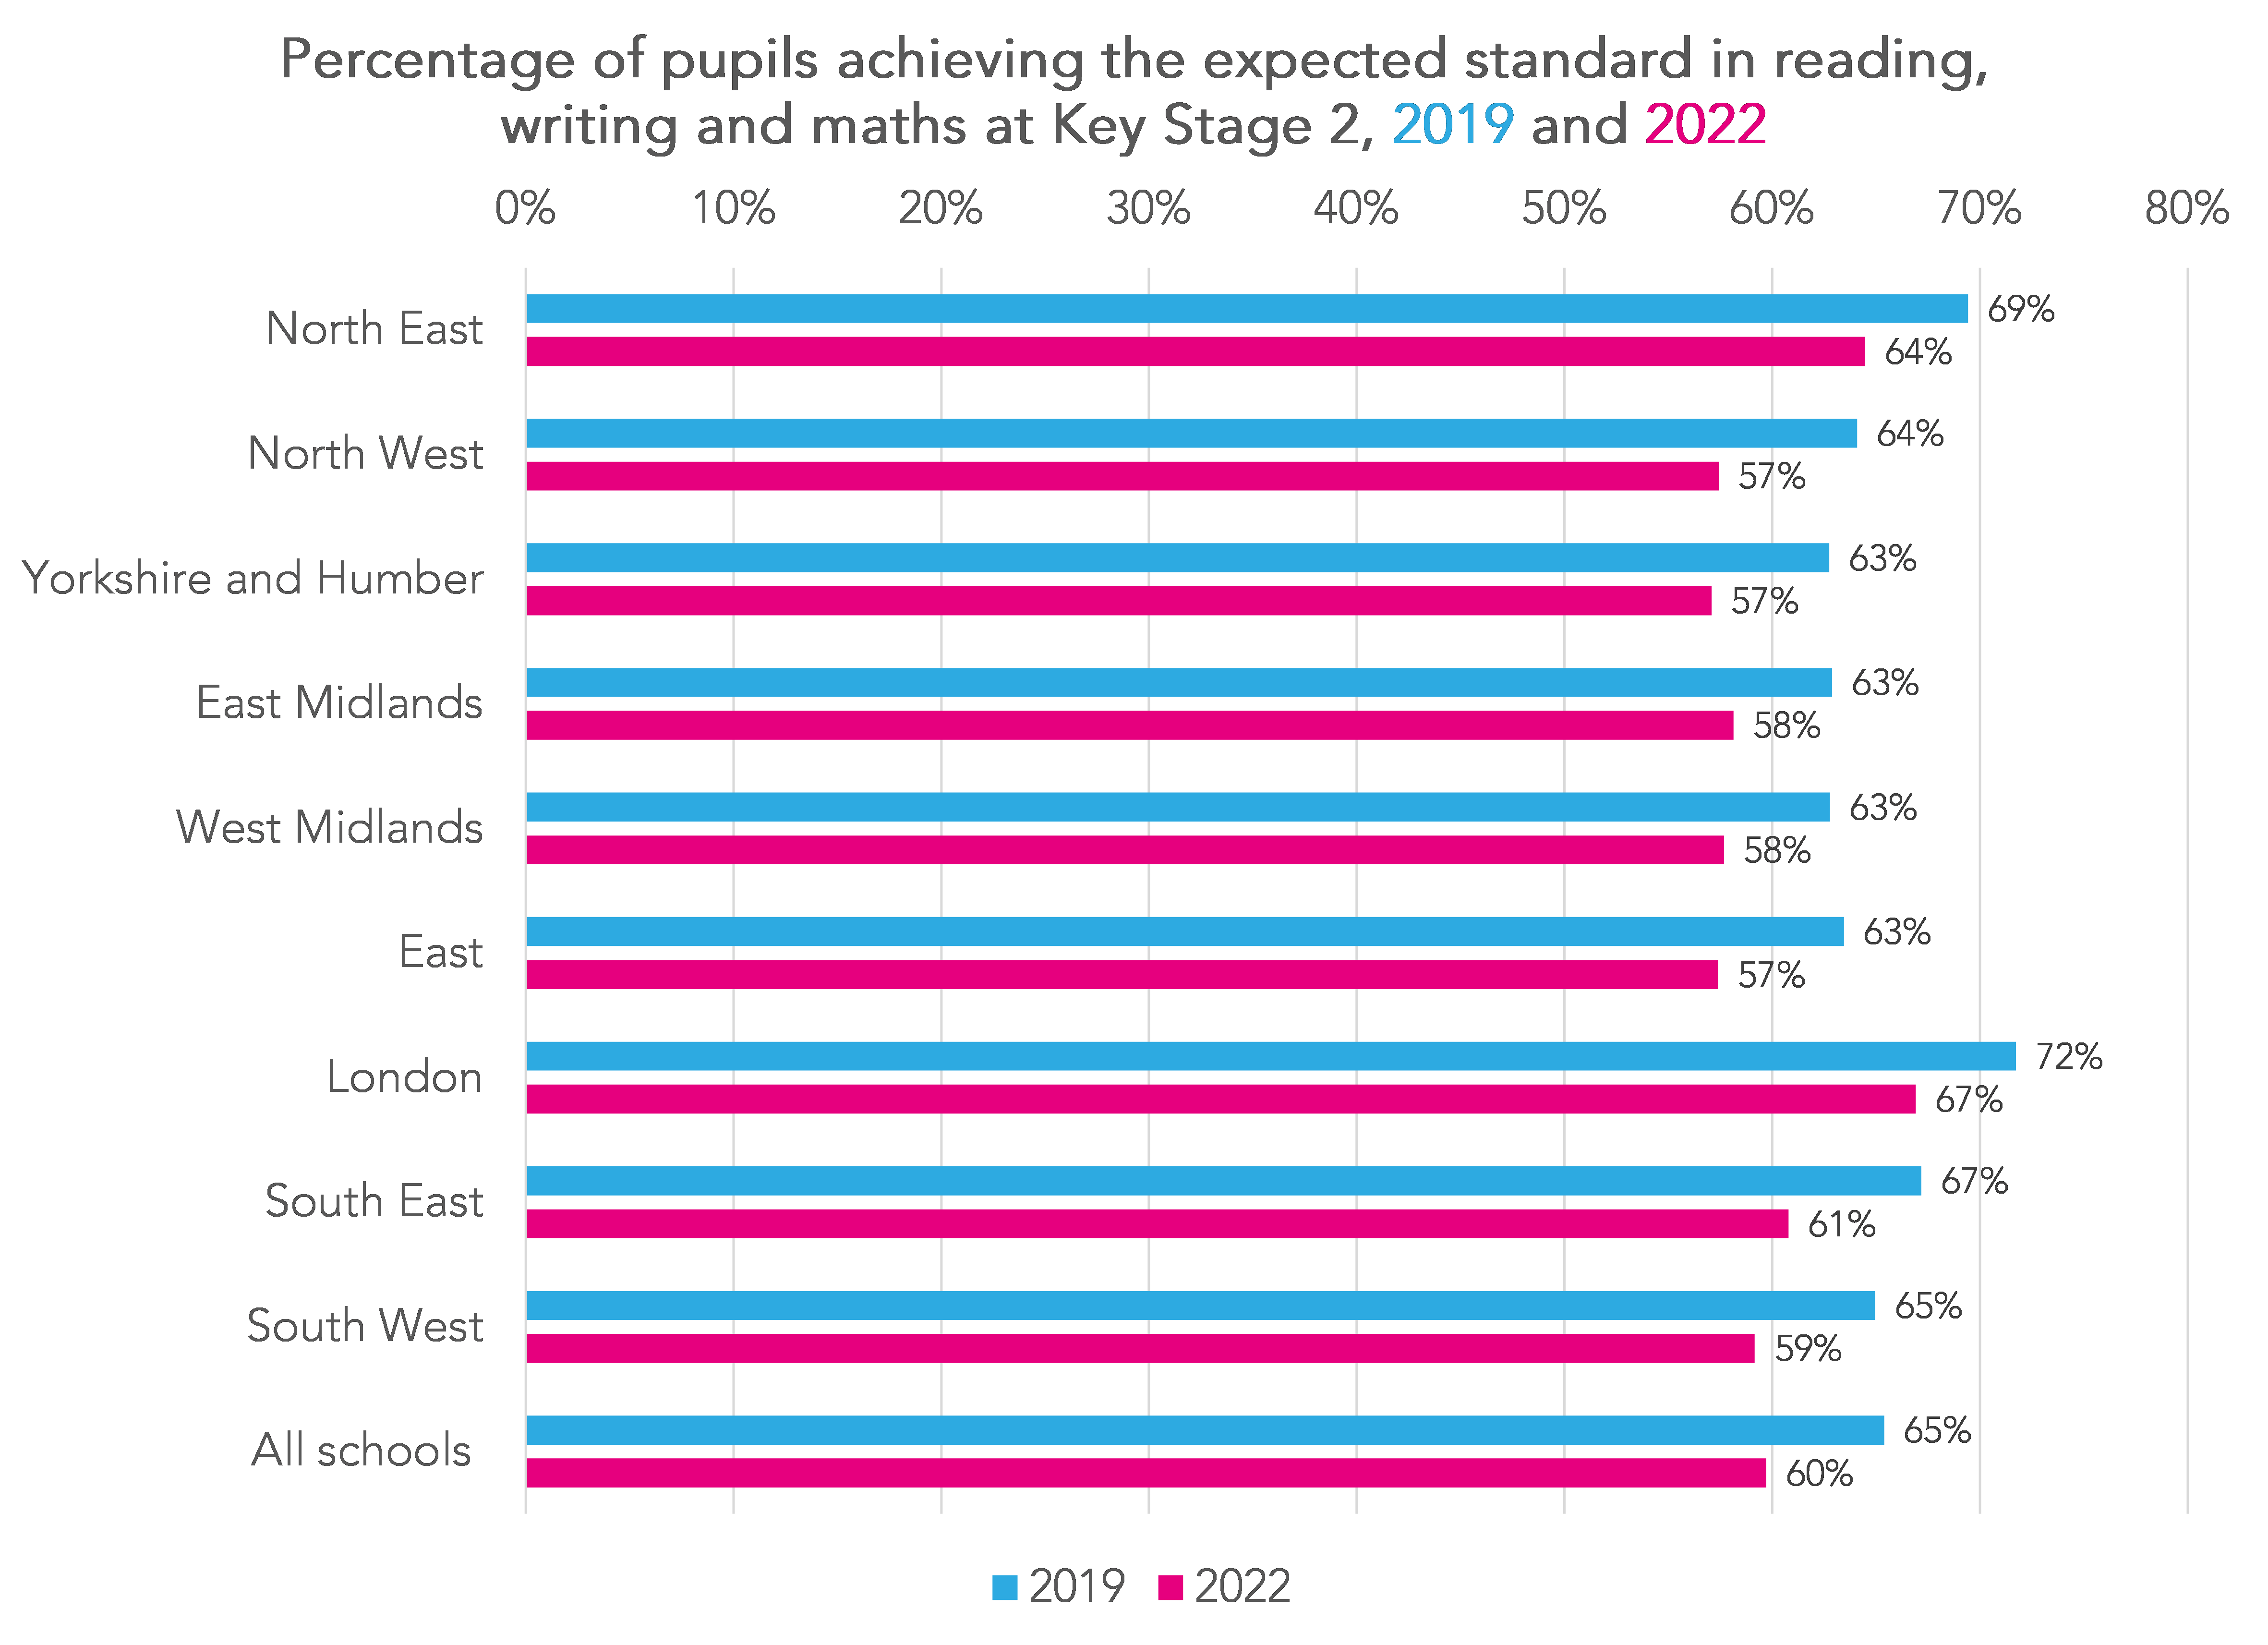 Attainment fell by less than 5 percentage points [1] not only in London and the North East (the two highest attaining regions in 2019) but also in the East Midlands (one of the lowest attaining regions in 2019).
By contrast, attainment fell by almost 7 percentage points in the North West.
In our previous post, based on a smaller number of schools, we calculated that, on average, attainment in maths had fallen by 1.2 scaled score points or 0.15 standard deviations. On the surface this doesn’t sound a lot, but could be equivalent to the learning gains pupils typically make in 2-3 months.
So let’s take a look at how this varied by region.
Repeating the analysis with a larger set of schools shows that the national change in attainment was slightly larger than previously calculated at 1.3 scaled score points (0.16 standard deviations).
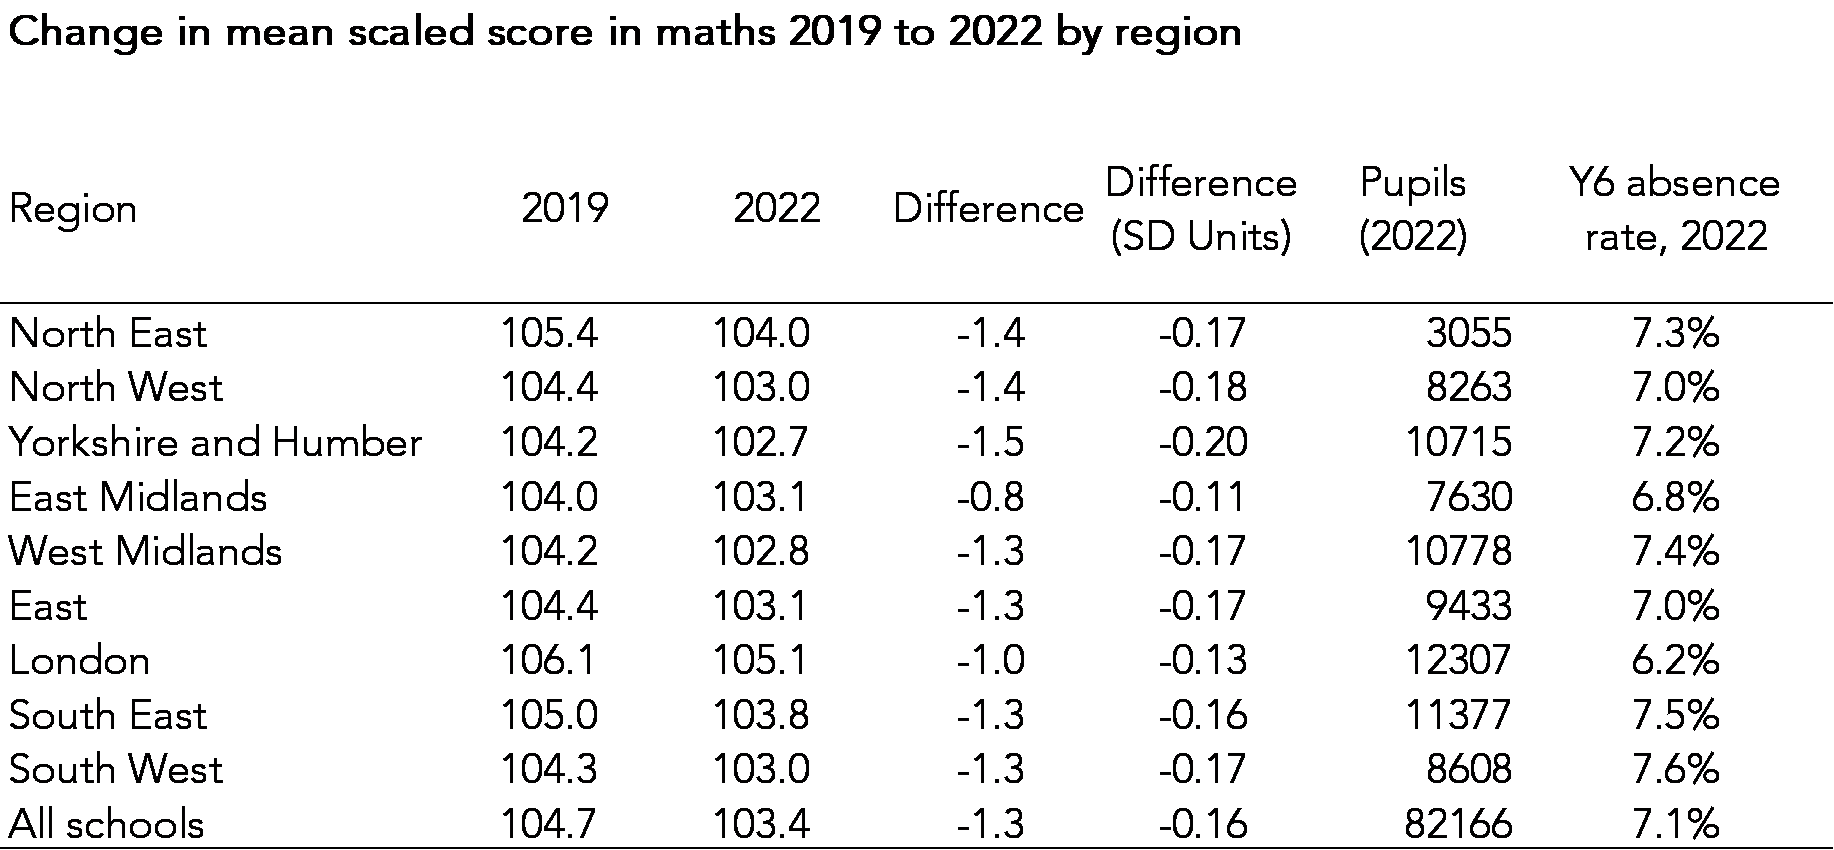
Schools in East Midlands and London recorded the smallest change on average: 0.11 and 0.13 standard deviations respectively. Perhaps coincidentally, the year 6 absence rate in these regions was lower than the other regions. Much more work will be done in time on the links between absence and attainment but perhaps schools in these regions experienced less disruption.
Attainment in maths appears to have fallen by the largest amount among schools in Yorkshire and Humber.
Summing up
The 2022 Key Stage 2 data provides an opportunity not to only to gauge the effects of the pandemic on pupil attainment at a national level but also to examine the extent to which existing differences narrowed or widened.
Based on the sample of data we’ve collected so far, it would seem that some regions have been slightly more affected than others. The full picture will emerge as more data becomes available.
- Based on unrounded percentages
Want to stay up-to-date with the latest research from FFT Education Datalab? Sign up to Datalab’s mailing list to get notifications about new blogposts, or to receive the team’s half-termly newsletter.

Leave A Comment