When last year’s exam results came out, we wrote about the increasing attainment gap between independent and state schools since the start of the pandemic.
But we weren’t able to clear up exactly why this had happened.
We said at the time that more and better data would be required to understand more. And, as we do now have access to some more detailed data on 2021 GCSE results (via the National Pupil Database), we’re going to revisit the topic.
The plan
We may as well own up at this point – we’re not going to be able to explain exactly why the attainment gap between independent and state schools increased between 2019 and 2021 in this post either. But we will be able to shed some more light on what the increase looks like.
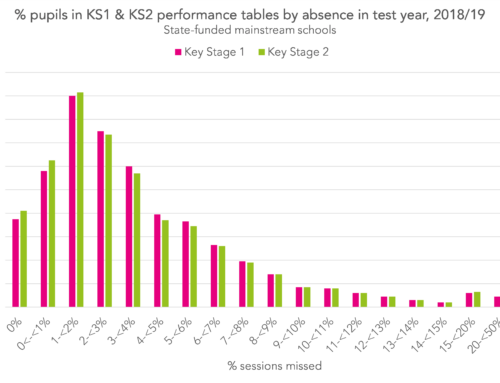
Our previous post, and Ofqual’s analysis, focused on the proportion of pupils achieving top grades. The chart below is taken from our original post.

The percentage of GCSEs entered by independent school pupils that were graded 7 or above increased from 46.6% to 61.2% between 2019 and 2021 – an increase of 14.6 percentage points. While in non-selective state-funded mainstream schools, the increase over the same period was just 7.5 percentage points.
In this post, we’re going to look at things from another angle.
We’ll start by creating models to predict pupils’ grades in GCSE maths and English based on their prior attainment and gender, for each year from 2017-21. We’ve selected English and maths because they are compulsory subjects at GCSEs.
We use a model to estimate the probability of achieving each grade at GCSE [1] for pupils in non-selective state-funded mainstream schools only.
A separate model will be fitted for each subject and year. This means that the models will take account of any changes in the relationship between prior attainment and grades between years – including the generally higher grades attained in 2020 and 2021.
We then use the models to calculate estimated grades for pupils who attended independent schools and selective mainstream schools. These give us an idea of the sorts of results pupils with similar prior attainment in non-selective mainstream schools achieved.
We then compare actual grades to these estimated grades.
This should show us if anything different happened in independent schools in 2020 and 2021.
Some caveats
There are some important limitations involved with using the National Pupil Database to analyse data related to independent schools.
Many pupils taking GCSEs at independent schools will not have taken tests at the end of Key Stage 2, particularly if they were at independent schools at the time. However, some independent schools do administer them and some pupils move into the independent sector from the primary sector during their secondary education. Overall, we have Key Stage 2 data for around 40% of independent school pupils.
This does mean that our dataset is less likely to include pupils who attended independent schools for the whole of their school career, so any conclusions that we draw will place more weight on pupils who attended a state primary school then went on to join an independent secondary school.
However, we’re interested in year-on-year changes here, and as we’ll be looking at similar subsets of pupils (i.e. only those with KS2 results) in each year, we should still be able to observe some interesting patterns.
It’s also fairly common for pupils in independent schools to take IGCSEs as an alternative to GCSEs. Data on grades awarded in IGCSEs is not available in the National Pupil Database. However, we can see that only 33% of pupils at independent schools entered GCSE maths in 2021 compared to over 99% in state-funded mainstream schools. The implication here is that the remaining two-thirds entered IGCSEs.
The results
Those limitations noted, we’ll press on with the results.
The charts below show the differences between estimated and actual GCSE grades for pupils by school type. We’ve included two school types: independent schools and selective state-funded mainstream schools (grammar schools). Selective state schools make a useful point of comparison because, like independent schools, their pupils tend to have high prior attainment.
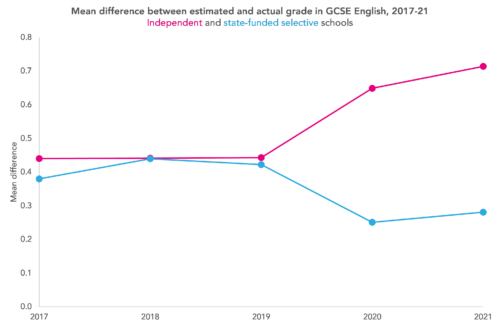

The charts show that in 2017, for example, pupils in both independent and selective schools achieved around 0.4 of a grade higher than our estimated grade in English, on average, and around 0.3 of a grade higher in maths.
Because our model is based on the grades achieved by pupils in non-selective state schools, this means that pupils in both independent and selective schools tended to achieve higher grades than pupils with similar prior attainment in non-selective mainstream schools (although there are some important caveats to bear in mind about the apparent gap between selective and non-selective schools).
Looking at the 2017-19 pre-pandemic period as a whole, pupils in independent schools tended to do better than predicted by our model in both English and maths. The same was true of pupils in selective state schools. In fact, the chart shows very little difference between the two school types before 2020.
But when we look at 2020 and 2021, something changes.
While pupils in both independent and selective state schools continued to achieve grades higher than our estimates, a gap opened up between the two. Pupils in independent schools exceeded their estimated grades by more than they did before the pandemic, while those in selective state schools exceeded them by less than pre-pandemic in English, and roughly the same in maths.
What does it all mean?
This analysis does seem to suggest that during the pandemic, under both centre-assessed grades (CAGs) and teacher-assessed grades (TAGs), independent schools gave out more generous grades than might be expected.
We’re still not clear on why that might be. One theory is that pupils in independent schools faced less disruption to their learning than other pupils. But, as we pointed out in our last post, TAGs at least attempted to correct for that to some extent.
The way that TAGs were awarded meant that if a pupil had been taught less content than another, this wouldn’t have mattered in determining grades. Compared to another pupil who had suffered less disruption, they would only be awarded a lower grade if the evidence suggested they had learned the content taught less well.
We’ll be watching with interest when this year’s results come out to see if the gap that opened up between independent and state schools during the pandemic begins to close when we return to an exam-based system of assessment.
[1]: We used multinomial regression models to estimate the probability of students achieving each grade, with the predictors: KS2 reading score, KS2 maths score, quadratic terms for both scores, gender, and interactions between gender and reading / maths scores.
Want to stay up-to-date with the latest research from FFT Education Datalab? Sign up to Datalab’s mailing list to get notifications about new blogposts, or to receive the team’s half-termly newsletter.


And have you calculated the impact of pressure from the customer – parental pressure on the school to give higher grades – are not independent school more prone to the pressure of satisfying the customer than are stare funded schools?
Hi Simon, thanks for commenting. You may well be right about this pressure on independent schools but we don’t really have any way of quantifying it, so it’s hard to tell how much impact it might have. I imagine the amount of pressure would vary quite a bit among independent schools – and of course there might still be a lot of pressure felt in some state funded schools too!