- Optimism about economic comebacks triggered a sell-off in safe-haven assets.
- Tensions between the US and China could be a risk factor for gold prices.
- XAU/USD correcting in the long-term, the decline may continue next week.
Gold prices are ending a third consecutive week in the red, collapsing towards the 1,670.00 level at the end of the week. The metal has been under pressure amid a stock market run, based purely on hopes of economic recoveries. Market players decided to ignore most of the negative factors that surged these last few days, including renewed stress between the US and China and riots in the world’s largest economy.
The US Nonfarm Payroll report released this Friday is behind the latest leg lower, as the economy surprisingly added 2.5 million jobs in May, while the unemployment rate increased to just 13.3%, against expectations of 19.8%. The numbers boosted hopes for an economic pickup, and equities soared, with US indexes soaring to their highest in three months. The dollar was only able to appreciate against safe-haven rivals.
US-China tensions a huge risk factor
As said, the market ignored negative factors, and the riskiest for gold is mounting tensions between the US and China. The latest has trim part of its agricultural buys to the country, while the US administration announced on Wednesday it barred Chinese passenger carriers from flying to the US starting June 16. Opposite to China, that’s allowing more foreign carriers to fly into the mainland. None of the parts involved has mentioned putting an end to their trade deal, but China warned the US is provoking a new “cold war,” accusing Washington of damaging the relationship with Beijing.
The US imposed new sanctions on 33 Chinese firms and institutions to take effect on June 5, blacklisting them for helping Beijing. On Friday, China’s Commerce Ministry announced it vows countermeasures against the US list of entities.
Macroeconomic data have little to offer
Despite improvements in services and manufacturing output in the US, the official ISM indexes remained in contraction territory in May. As said, employment also improved, but there’s nothing to cheer about a 13.3% unemployment rate. The long path to recovery does not even start. Also, Factory Orders were better than anticipated, but down by 13% in April. In the same month, the Trade Balance posted a deficit of $49.4B, larger than anticipated.
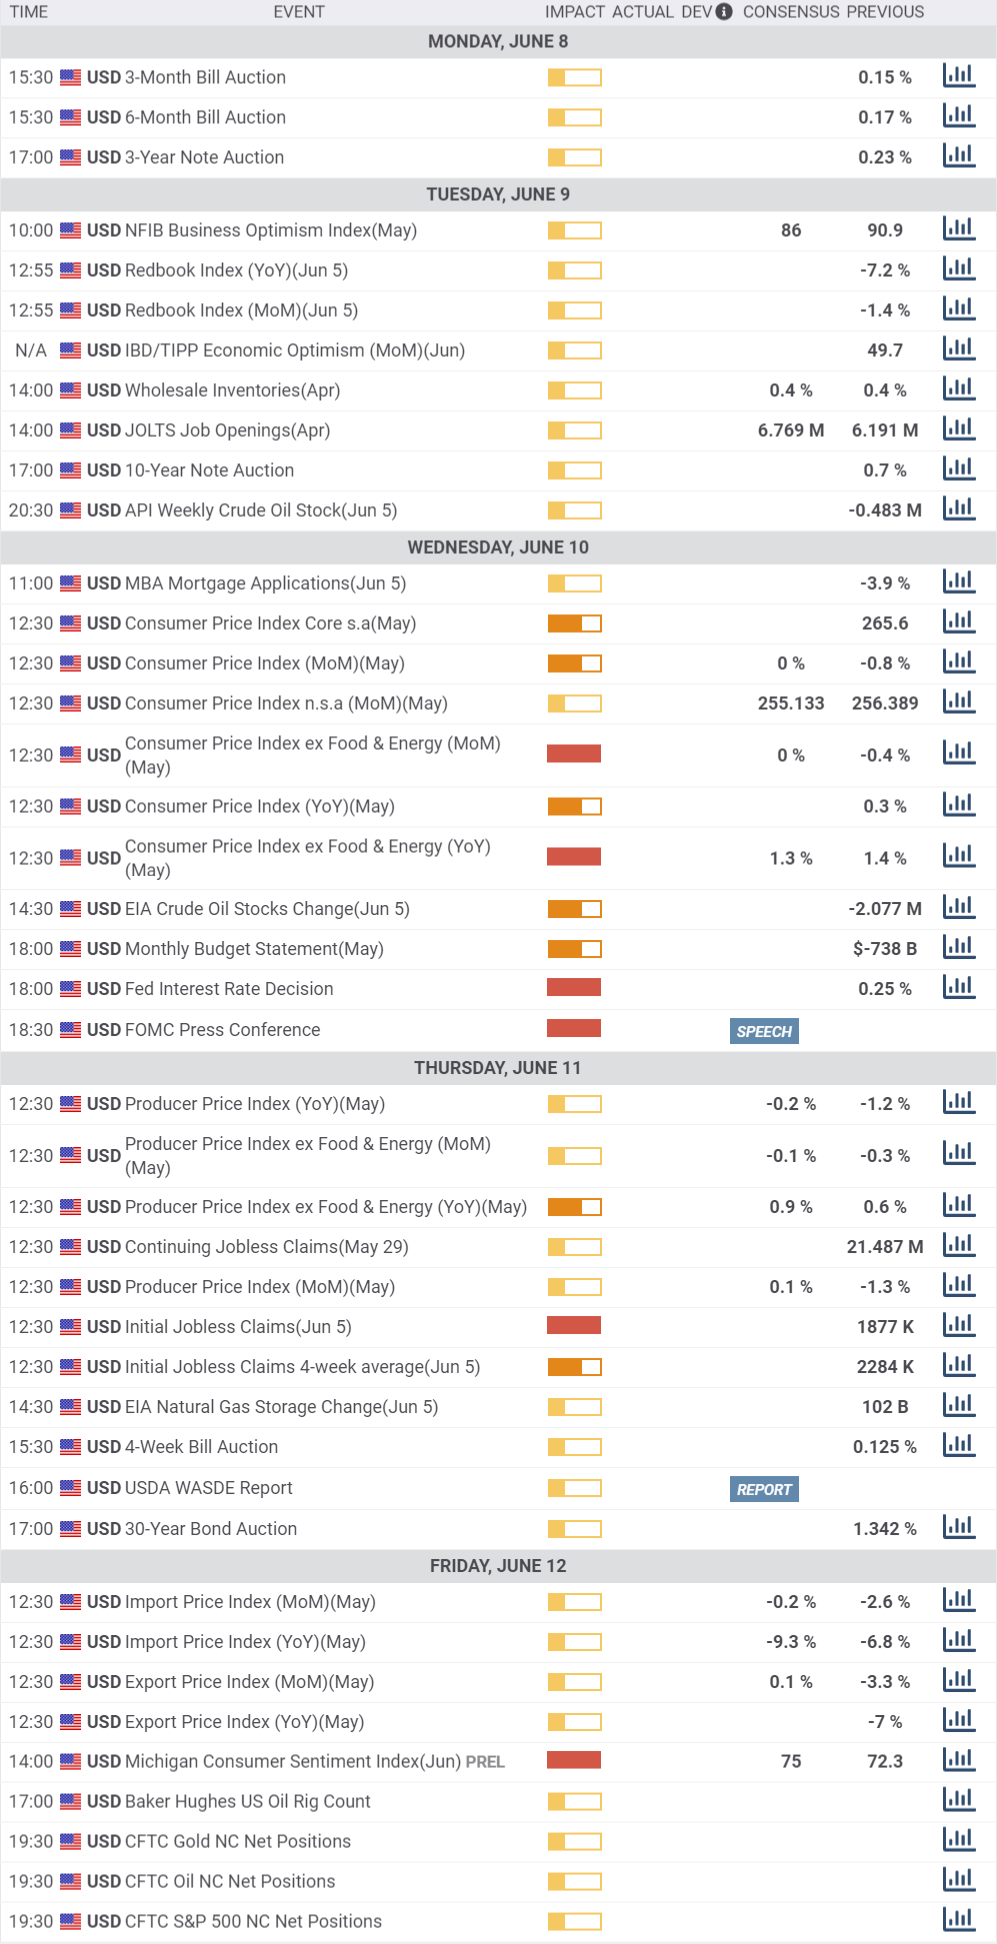
The market has already priced in those terrible numbers way ahead of the respective releases, and will likely pay little attention to April and May data. With that in mind, the most relevant macroeconomic release next week will be the preliminary estimate of the Michigan Consumer Sentiment Index, seen bouncing from 72.3 to 75. The US will also publish May inflation data, and the usual weekly unemployment figures, although their impact on price action could also be overshadowed by sentiment.
Spot Gold Technical Outlook
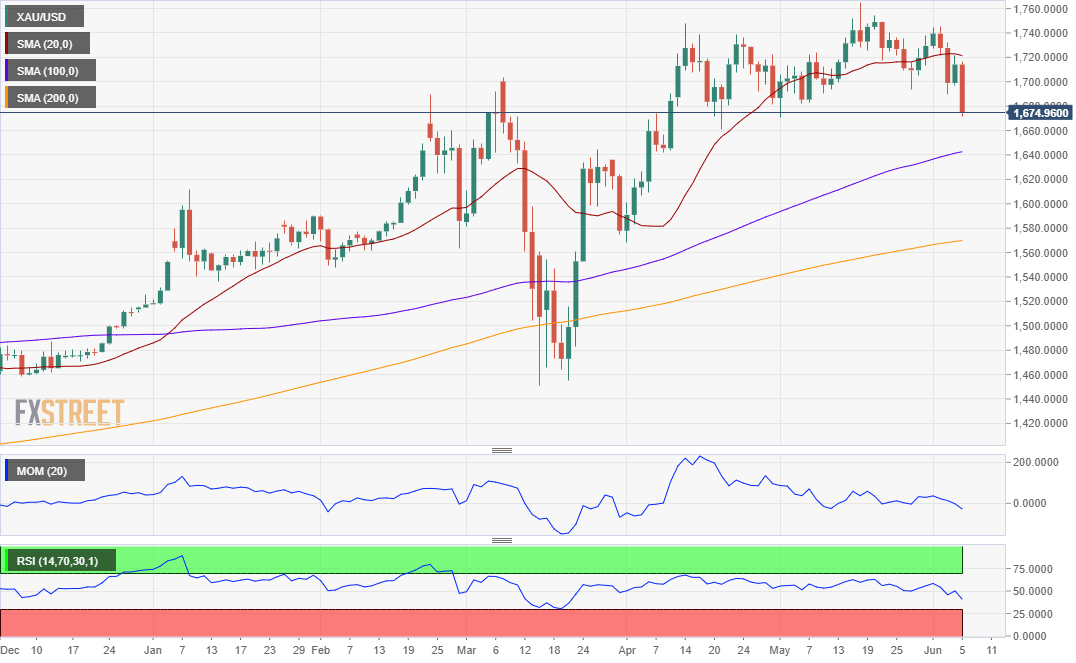
Spot gold trades at fresh five-week lows as the day comes to an end, and as said, approaching $1,670.00 a troy ounce. The sharp decline remains as corrective in the long term, as the weekly chart shows that the commodity continues to develop above a firmly bullish 20 SMA, while over $270 above the 100 SMA. Technical indicators retreated sharply from near overbought readings, although the Momentum indicator stabilised well above its midline while the RSI indicator keeps heading south, but at around 55. Not enough to confirm another leg south.
Technical readings in the daily chart, however, suggest that the decline may continue. The metal collapsed after completing a pullback to a broken 20 DMA. Technical indicators head firmly south within negative levels, and at their lowest since mid-March.
A relevant low comes at 1,670.25, which provides immediate support. Below this last, the next support comes at April 21st low at 1,658.78. Resistances, on the other hand, come at around 1,705 and 1722.
Gold Sentiment Poll
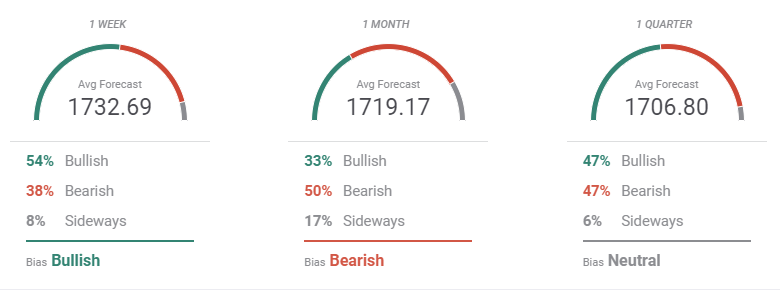
The FXStreet Forecast Poll indicates that speculative interest didn’t see the NFP coming, as most market players are betting for a bullish extension in the short-term towards 1,730. However, a corrective movement was anticipated as the outlook is bearish in the monthly perspective and neutral in the quarterly view. The average target, however, decreases as time goes by.
In the Overview chart, the weekly and monthly moving averages are neutral, but the long-term one is turning south. Still, it seems too early to call for a steeper decline. For now, the decline should be considered corrective.
Related Forecasts:
GBP/USD Forecast: After the big breakout, Boris' Brexit move, UK GDP, and the Fed are keys
AUD/USD Forecast: Is the highest in a year at reach? Fed, relations with China and COVID stats eyed
Information on these pages contains forward-looking statements that involve risks and uncertainties. Markets and instruments profiled on this page are for informational purposes only and should not in any way come across as a recommendation to buy or sell in these assets. You should do your own thorough research before making any investment decisions. FXStreet does not in any way guarantee that this information is free from mistakes, errors, or material misstatements. It also does not guarantee that this information is of a timely nature. Investing in Open Markets involves a great deal of risk, including the loss of all or a portion of your investment, as well as emotional distress. All risks, losses and costs associated with investing, including total loss of principal, are your responsibility. The views and opinions expressed in this article are those of the authors and do not necessarily reflect the official policy or position of FXStreet nor its advertisers. The author will not be held responsible for information that is found at the end of links posted on this page.
If not otherwise explicitly mentioned in the body of the article, at the time of writing, the author has no position in any stock mentioned in this article and no business relationship with any company mentioned. The author has not received compensation for writing this article, other than from FXStreet.
FXStreet and the author do not provide personalized recommendations. The author makes no representations as to the accuracy, completeness, or suitability of this information. FXStreet and the author will not be liable for any errors, omissions or any losses, injuries or damages arising from this information and its display or use. Errors and omissions excepted.
The author and FXStreet are not registered investment advisors and nothing in this article is intended to be investment advice.
Recommended Content
Editors’ Picks
EUR/USD holds above 1.0800 ahead of Eurozone GDP, US inflation data

EUR/USD stays in positive territory above 1.0800 after registering its highest daily close in over a month on Tuesday. Investors await first-quarter GDP data from the Euro area and April Consumer Price Index data from the US.
GBP/USD consolidates its gains above 1.2580, all eyes on US CPI data

GBP/USD consolidates its gains around 1.2590 during the Asian session on Wednesday. The major pair holds above the key 100-day EMA but remains capped under the 1.2600 hurdle. The US CPI and Retail Sales report for April will be in the spotlight.
Gold price trades with a mild positive bias, US CPI and PPI data loom

Gold price posts modest gains on the weaker US Dollar on Wednesday. The rising gold demand from robust over-the-counter market investments, consistent central bank purchases, and safe-haven flows amid Middle East geopolitical risk act as a tailwind for XAU/USD.
Ethereum bears attempt to take lead following increased odds for a spot ETH ETF denial

Ethereum is indicating signs of a bearish move on Tuesday as it is largely trading horizontally. Its co-founder Vitalik Buterin has also proposed a new type of gas fee structure, while the chances of the SEC approving a spot ETH ETF decrease with every passing day.
US CPI data expected to show slow progress towards 2% target

The US Consumer Price Index is set to rise 3.4% YoY in April, following the 3.5% increase in March. Annual core CPI inflation is expected to edge lower to 3.6% in April. The inflation report could influence the timing of the Fed’s policy pivot.