
Kubernetes automatically validates the health of your pods within your k8s cluster, by continuously evaluating the health end-points (livenessProbe and readinessProbe) of your deployed services. While this is a key capability, as k8s will restart pods that are unhealthy, it doesn’t guarantee that services exposed via Ingress are also available and responding within your SLAs to those that rely on these services: your end-users or service consumers outside k8s that call your services.
Christian Heckelmann, Senior Systems Engineer at ERT, inspired me to write this blog when he brought up this topic in a conversation a couple of weeks back. He said that any mistake with Ingress configuration, Load Balancers, or any other network component that sits between the consumer and the actual service running in k8s can lead to SLA violations while Kubernetes internal health checks still report that everything is green. Not only did Christian bring this to my attention – he also came up with two automated solutions to fix this problem!
Option 1: Automate external SLA and SLO checks through Delivery Pipeline
To tackle this problem Christian experimented with automatically creating Dynatrace Synthetic Tests as part of his GitLab Pipelines. You can find his sample project on his Dynatrace Pipeline GitLab repo and explore the individual Dynatrace extensions in the ci-includes subfolder:
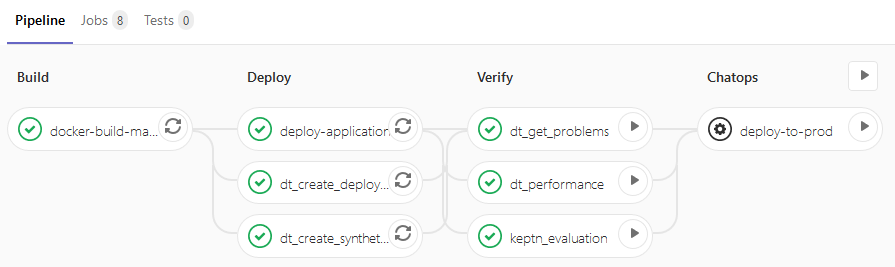
Here’s what Christian is doing in the individual phases of the pipeline run:
Deploy Phase:
- Deploy Application: in this case mostly to EKS but could also be any non-k8s systems.
- Create Deployment Event: the Dynatrace Events API is used to push a deployment event to Dynatrace.
- Create Synthetic Test: Query the readiness endpoint and ingress of the deployed service, then create a Dynatrace Synthetic Test through the Dynatrace Synthetic API. This automatically tests this endpoint from various external locations.
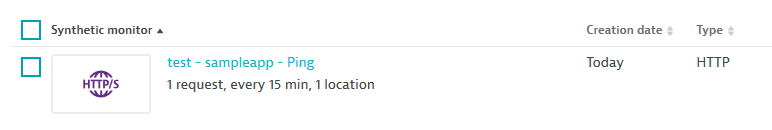
After he is calling dt_create_synthetic the newly created synthetic test shows up in Dynatrace and gets executed on the defined scheduled to validate the SLAs of the deployed service:
After the deployment phase is done it’s time to validate the deployment, by doing the following:
Verify phase:
- Get problems: Pulls any identified problems through the Dynatrace Problems API and reports it back to the pipeline.
- Get performance: User queries some metrics from the Dynatrace Timeseries API that are important to observe.
- Keptn Quality Gate: User calls the Keptn Quality Gate API to validate SLOs.
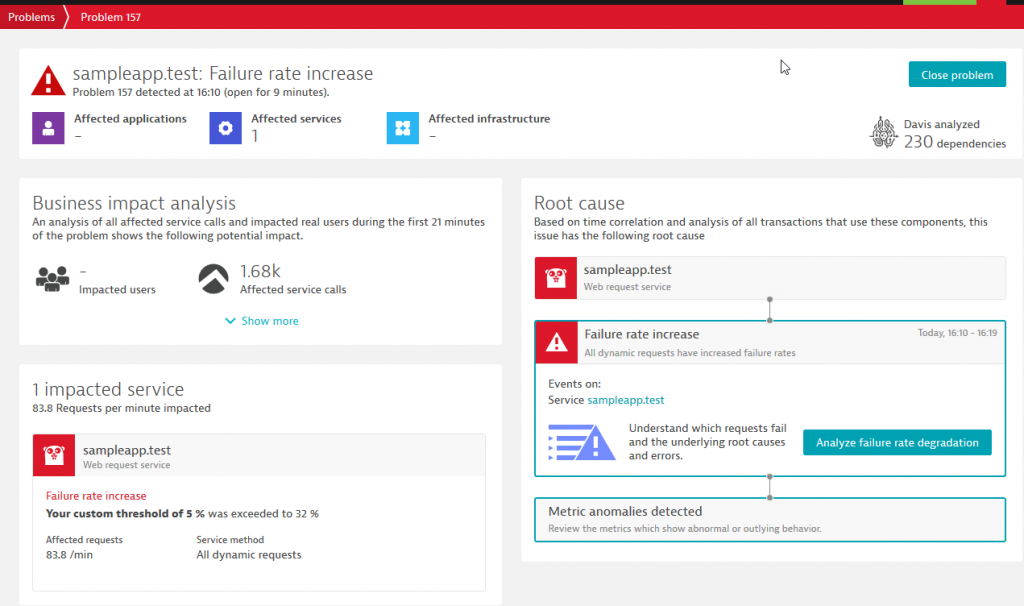
If there’s a problem accessing the service, such as a high failure rate or slow response, then Dynatrace automatically opens a problem like:
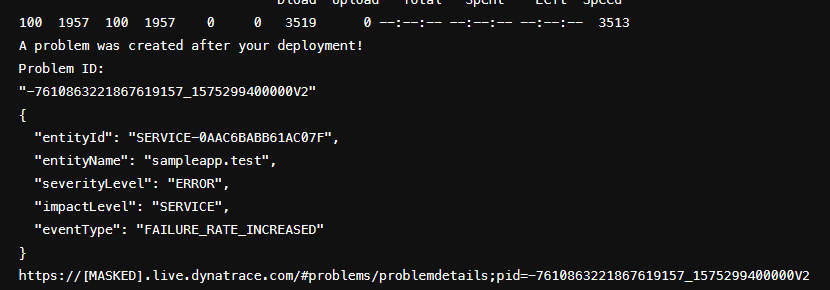
In the event a problem was detected, Christian pulls the problem details back to the pipeline in the Verify Phase. His dt_get_problems script uses the Dynatrace Problem API to query whether there are any open problems detected by the test created earlier. If there are, he reports this back to his pipeline.
Option 2: Automate external SLA checks through Kubernetes Operator
While the pipeline approach works very well, it only covers changes which are deployed through pipelines that include the Dynatrace extensions he scripted. It wouldn’t cover deployments or configuration changes done by other tools or those done manually by him or his colleagues.
To enable automated SLA monitoring from outside the k8s cluster for deployed services exposed via an Ingress, Christian turned to the Operator Framework. He developed the Synop Operator that automates the creation of the Dynatrace Synthetic Tests with every deployment of an Ingress – no matter who or which tool is deploying or changing that Ingress. The Synop Operator picks up annotations from the Ingress and then:
- Decides whether the ingress should be monitored – synop/create: “true”.
- Configures a Dynatrace Synthetic Monitor for that exposed endpoint: synop/endpoint.
- Additional configures locations, frequency and tags through defined through optional k8s annotations.
For full documentation check out the Synop Operator GitLab Repo. The video below which shows:
- Installing the Synop Operator.
- Deploying a new application including ingress.
- Operator automatically creates the Dynatrace Synthetic Test.
As part of the video above Christian shows the log output of his Synop Operator showing that a new Synthetic Test got created when the Operator was notified about a new Ingress configuration:
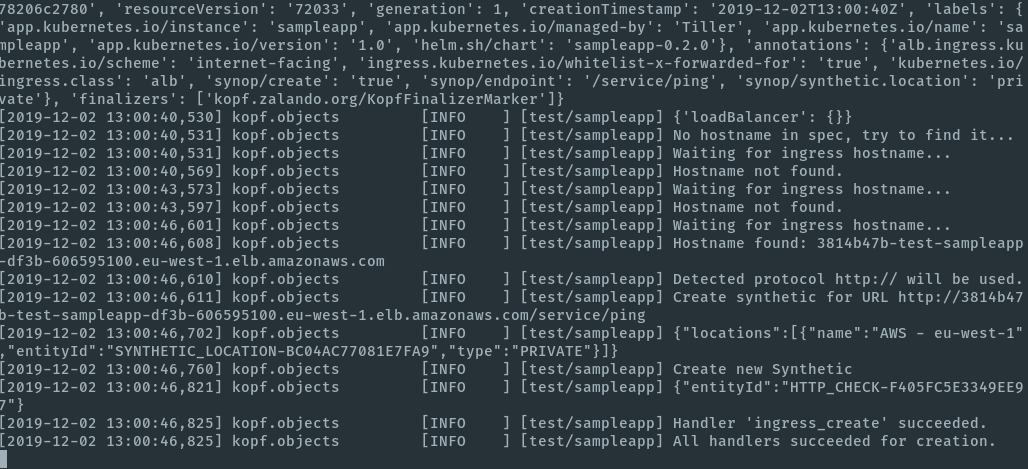
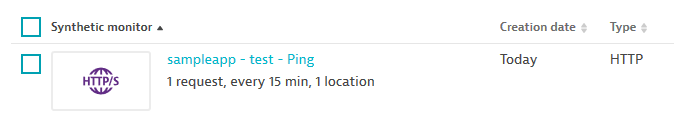
Just as before, the new test immediately shows up in Dynatrace and from now on validates SLA of that Ingress endpoint:
This is a great use case for an Operator, as this enables everyone who defines Ingress in k8s to automatically get SLA Ingress Monitoring with Dynatrace. With the addition of tags you can also leverage Dynatrace Problem Notifications with Alerting Profiles to send alerts to the right teams, e.g: via Slack.

Making Ops-life easier
Thanks to Christian for implementing these two solutions that make Ops-Life Easier as you so nicely put it in the description of your Synop Operator.
Very glad you’re contributing to the NoOps / ACM (Autonomous Cloud Management) community so that more can benefit from these automation solutions. To hear more from Christian and his expereince, make sure you visit our Breakout Session at Dynatrace’s Perform Las Vegas 2020 conference in February. Christian is co-presenting in my Release Better Software Faster Track on the topic Build resiliency into your continuous delivery pipeline with AI and automation. If you are reading this and if you are attending Perform make sure to meet Christian and give him your direct feedback on his work.


Looking for answers?
Start a new discussion or ask for help in our Q&A forum.
Go to forum