Before Natalie Portman slipped on a pair of ballet shoes and won an Academy Award, the term “black swan” was already full of psychological tension. Nassim Taleb coined the term to describe extreme, unforeseeable events with nasty consequences, whether in the natural world or in financial markets.
A notch down from there, we find what can be described as “gray swans”—things that are stronger than anything we’ve seen, but that we can foresee to be physically possible. Given that we have pretty short historical records in most places, it’s not much of a stretch to accept that we haven’t experienced the full range of possible weather. And after all, low probability events happen eventually.
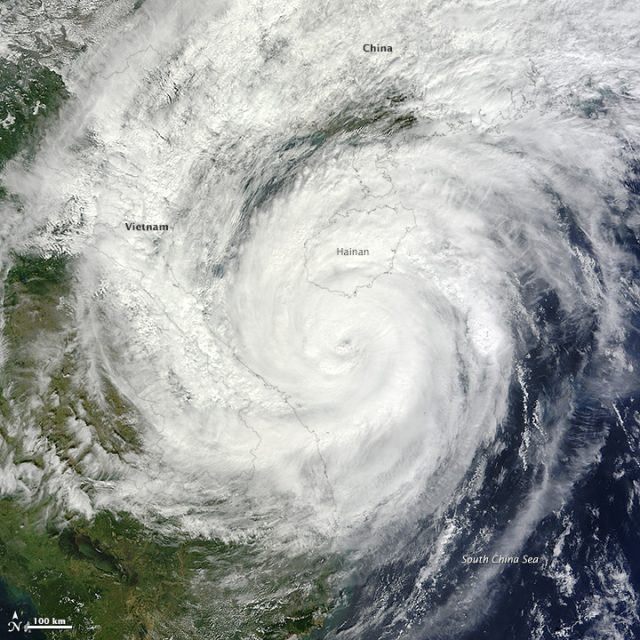
Recently Princeton’s Ning Lin and MIT’s Kerry Emanuel went gray swan hunting in the world of tropical cyclones, using climate models to simulate many more storms than exist in our brief historical records. And some of the gray swans they found look like mean bastards.
The researchers focused on tropical cyclones in three areas where cities are vulnerable to storm surge—Tampa, Florida; Cairns, Australia; and the Persian Gulf. The researchers combined several types of models, an approach that was used to look at New York City after Hurricane Sandy. Using actual, observed weather conditions—or model projections of conditions later this century—they introduced little baby storms to increase the number that grew into full-fledged hurricanes.
After simulating thousands of these storms in the region around a given city, they identified the ones that made landfall near that city and used the simulated data to model the storm surge that would come along with each storm. The result is a large set of possible cyclones, including some epic extremes and enough storms to estimate the probability of a storm that large.
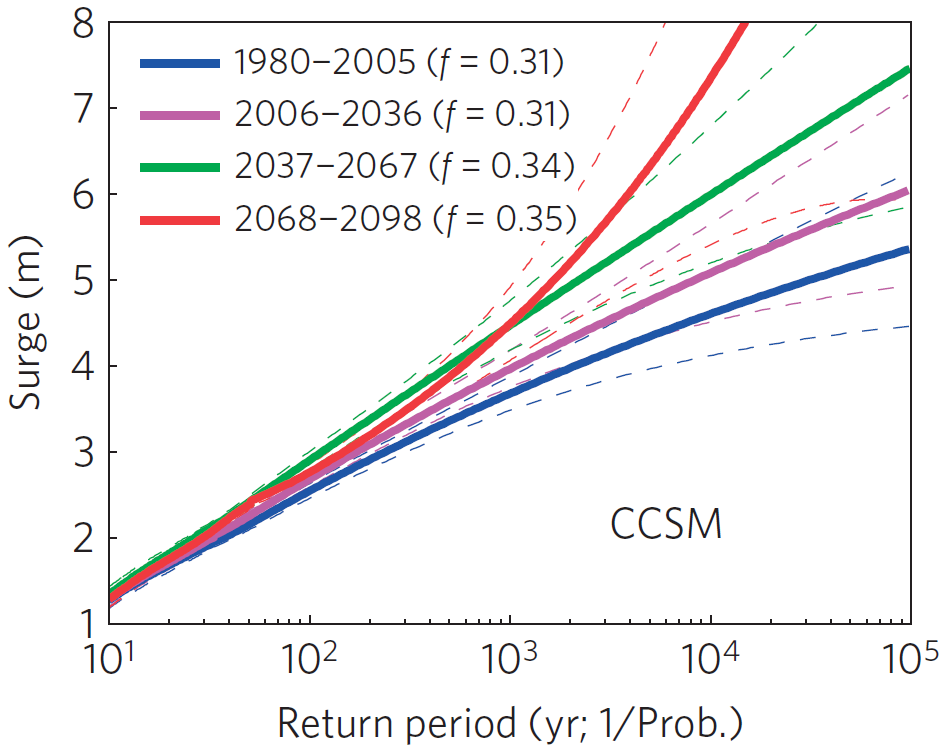
For Tampa, they simulated thousands of storms for 1980-2005 weather conditions, as well as a global warming scenario for the early, middle, and late 2000s. The most damaging hurricane in Tampa’s recent history was a 1921 storm that hit the city with 3-3.5 meters of storm surge, bad news for a low-lying area that is generally less than 6 meters above sea level.
But with modern weather conditions, the worst simulated storm—taking a similar track as the 1921 storm but with stronger winds—produced a storm surge just shy of six meters. Using a warmer world late this century, a simulated storm running north along the coast before turning inland over Tampa Bay generated a whopping 11 meters of sea level rise.
To be sure, these are low probability events. The six meter storm was estimated to be a 10,000-year storm (meaning the odds of it occurring in any given year is one in 10,000). But in a warmer world, these numbers change. The 1921 storm is about a 100-year to 300-year storm in modern conditions, but it could be a 60-year storm later this century. In fact, it’s the extreme storms that increase in probability the most.
On the eastern side of Australia’s Cape York, the city of Cairns has dodged pretty much every major cyclone in the area in recent memory. But simulating a couple thousand cyclones in modern weather conditions showed that there’s no reason that luck has to continue. The worst virtual cyclone, at least a 10,000-year storm, brought a storm surge of close to six meters. But they also calculated the 100-year surge to be about 1.6 meters, and the 1,000-year surge to be about 3.5 meters.
Previous attempts to estimate these numbers based on historical records came up with smaller surges—about 2.2 meters for the 1,000-year storm, and 2.6 meters for a 10,000-year storm. Evidence from the geologic record lines up much better with the newly modeled numbers.
As for Dubai, Abu Dhabi, and Doha in the Persian Gulf, the results were quite surprising. The warm, shallow water of the Persian Gulf looks like jet fuel to a cyclone, but no cyclones have ever been observed to make it into the Gulf from the Arabian Sea, where they occasionally form. (Though in 2007, Cyclone Gonu came close.)
The researchers simulated more than 3,000 cyclones in modern conditions for each of these three cities, including some that successfully made it into the Persian Gulf. But most of the dangerous cyclones were actually born within the Persian Gulf itself, and they included some doozies. The biggest to hit Dubai had a storm surge of almost 7.5 meters. Typhoon Haiyan is thought to hold the record for strongest winds in a cyclone at around 87 meters per second. This simulated monster in the Persian Gulf hit an unbelievable 115 meters per second.
Studies like this—and those revealing the geologic storm record—can help cities understand the risks we should be prepared for. Even if it’s infeasible to fully prepare for a 20,000-year storm, it’s useful to know how big those gray swans are. And as the world warms and sea level rises, these risks also change, complicating an already complicated challenge.
Nature Climate Change, 2015. DOI: 10.1038/nclimate2777 (About DOIs).
reader comments
88