
;)
Untangle Your Mind!
Sign up for our free newsletter and start your day with clear-headed reporting on the latest topics in education.
Fifty states, 50 different education systems, 50 different sets of tests.
That has long been the structure of the United States’ famously decentralized education system. If you were moving from New York City to the New Jersey suburbs and wanted to compare schools, good luck with that! The states have different tests, and neither is necessarily benchmarked to any external standard.1
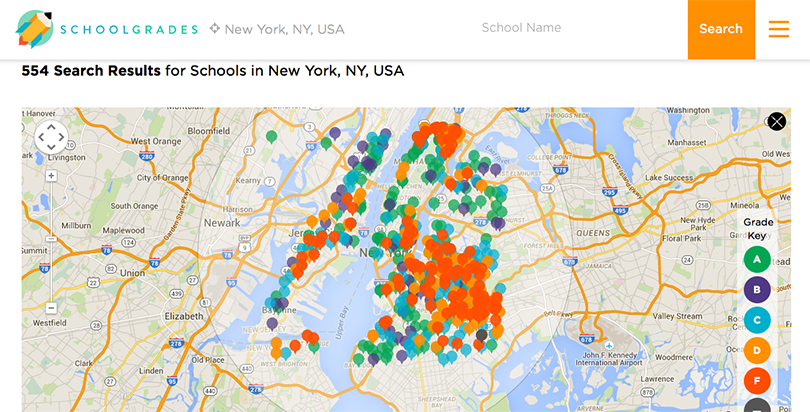
The Manhattan Institute, a New York-based, right-of-center think tank, recently set out to change that, unveiling a new, one-of-a-kind website called School Grades. As its name suggests, the site gives letter grades to nearly 70,000 public elementary and middle schools across 50 states — schools that educate approximately 34 million children. (About 1,500 schools were excluded due to incomplete data. High schools were left out because upper grade students usually don’t take the standardized tests that allow for such comparisons.)
Schools are graded on a traditional A–F scale (no pluses or minuses though). Results are fairly evenly distributed with 23 percent of schools earning an A, 19 percent earning a B, 22 percent earning a C, 19 percent earning a D, and 17 percent earning an F. The site billboards the state with the most As — Massachusetts — but does not call out the one with the most Fs.
The creators of the site, Jake Vigdor and Josh McGee, blended a conceptually simple approach with some statistical wizardry to produce these grades. First they took the percent of students who score ‘proficient’ — meaning they met the state’s benchmark for skills in a particular subject — on state exams. They then made that percent consistent across states by using the National Assessment of Educational Progress. The NAEP is a national, no-stakes test with results reported by state, and sometimes district, but never broken out by individual schools. Next, they statistically adjusted for students’ economic backgrounds so as not to unfairly penalize schools in high-poverty areas. And, then, voila, out pops an internationally benchmarked final letter grade.
Simple, right? Not really.
The exercise is fraught with conceptual and statistical challenges. For instance: to what extent should adjustments be made for poverty? Is it fair to give schools a grade based exclusively on math and reading test scores when we know they do much more than teach those two subjects?
And pesky data issues abound: Measures for poverty are crude at best; using test score proficiency rates ignores how far above or below that bar students are at.
Vigdor, in an interview, acknowledged these challenges. “'We're using a lowest-common denominator methodology,” he said, but pointed out that a higher-quality approach would have only allowed the map to cover a handful of states because better data is not always available.
Vigdor argues that School Grades shouldn’t be compared to some platonic ideal, but to other websites that are currently grading schools. Take Great Schools, a popular site for parents that rates schools on a scale of 1–10. For the vast majority of states, the site judges schools exclusively on state proficiency rates, with no adjustment for poverty and no ability to compare across states.
Great Schools also ensures a bell curve in each state — meaning there will always be some great schools, some average and some bad — whereas School Grades uses an international benchmark, meaning the site judges how well all the schools in the country measure up to the same standard.
Considering that argument, Vigdor is right. The new site offers a major upgrade from what’s currently available to parents. School Grades has a terrific, user-friendly interface, it is ambitious in both scope and formula, and it takes its methodology more seriously than many other sites that purport to judge schools — and even some district and state-level school accountability systems.
But based on looking at several major metro areas — see New York City below, for example, where most of the “bad” schools in Manhattan appear to be clustered in just a couple areas — I’m concerned that School Grades hasn’t gone far enough in adjusting for economic disadvantage.
We know that low-income students often attend the least-effective schools, but not to the extent that many believe. I also worry that that the site might contribute to the unhealthy notion that schools can — and should — quite literally be graded exclusively on how they teach math and reading.
Still, there’s a lot to like here, and research has shown that teachers and schools can improve in response to a poor school grade. The question for School Grades is how parents will respond. Here’s hoping they will take it both seriously and with a grain of salt.
Footnotes:
1. This is changing to some extent with the Common Core testing consortia, but there remains a huge diversity in state testing systems. (Return to story)
Get stories like these delivered straight to your inbox. Sign up for The 74 Newsletter