Technology
The Most Valuable Brand in Each Country in 2018
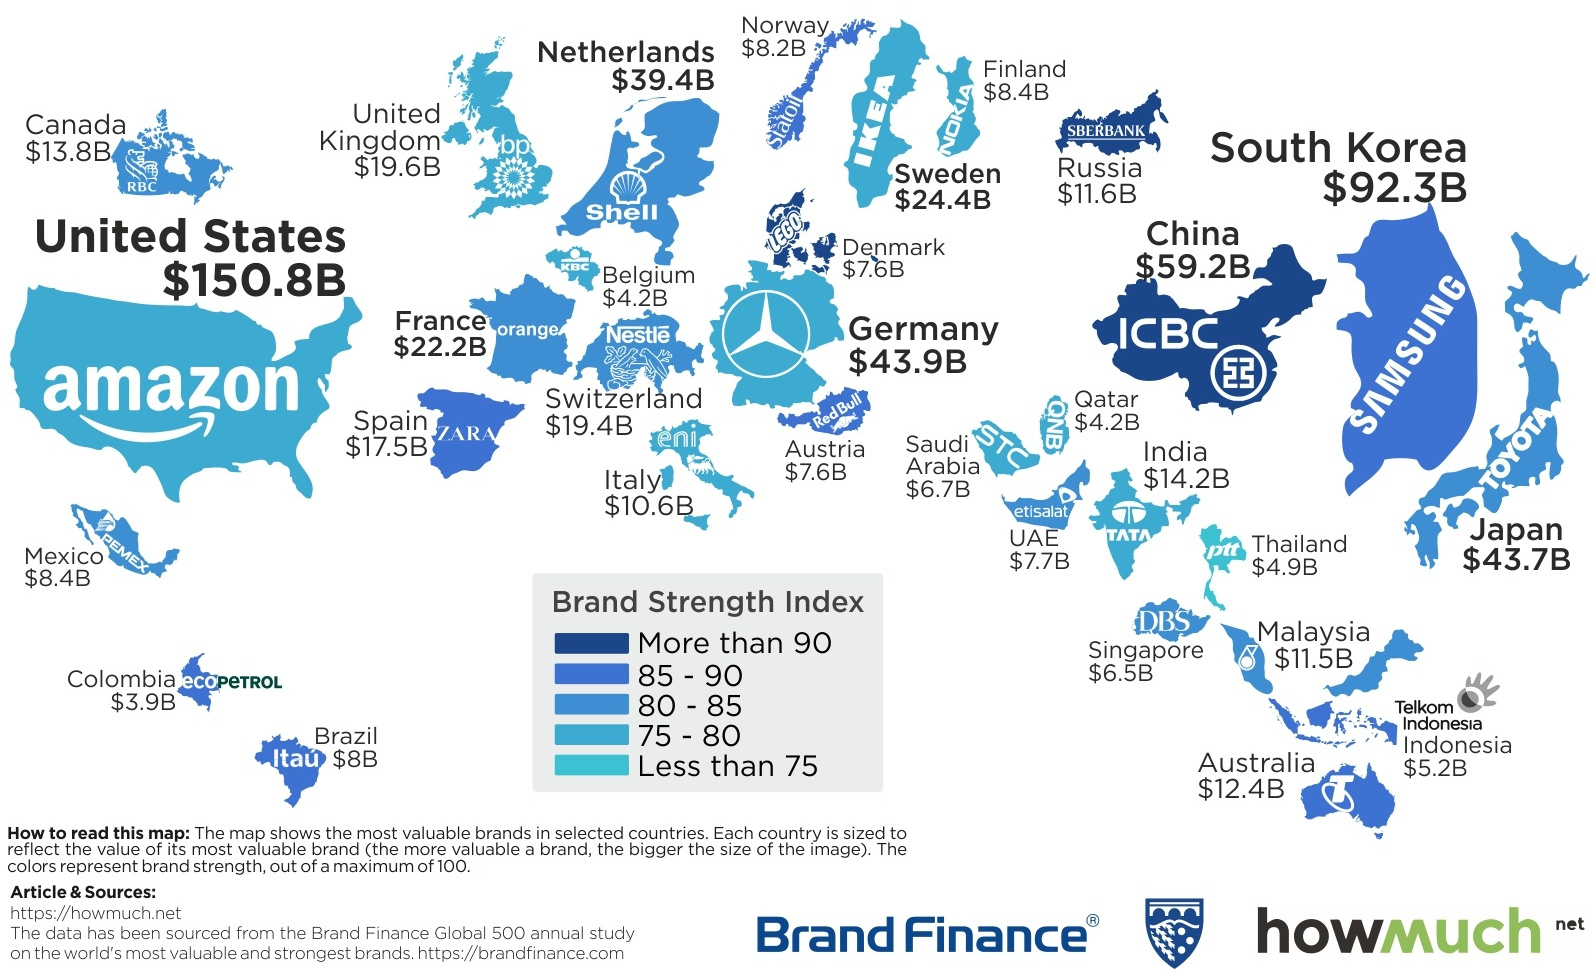
Map: The Most Valuable Brand in Each Country in 2018
Last year, we covered the world’s top brands based on the measure of brand value, and one thing stood out.
The top of the list was dominated by U.S. brands like Google, Amazon, Facebook, Visa, AT&T, and McDonald’s, but only one non-American brand (China’s Tencent) was able to crack the top 10 list.
Today’s infographic comes to us from HowMuch.net, and it helps to make the international brand value picture a lot clearer. Using updated rankings from Brand Finance’s Global 500 Report, it shows the top brand for each country in 2018.
It’s worth noting, however, that there are many countries that are not represented here, as they do not have a brand large enough to make the top 500 list.
A Steep Dropoff
Keeping the aforementioned U.S. dominance of brands in mind, there is a pretty steep drop from the U.S. to other countries on the map. After retail giant Amazon, which ranks as the world’s top brand at $150.8 billion, the next biggest brand in any other country is Samsung (South Korea) at $92.3 billion.
From there, it’s another big fall to get to the next tier, which includes China’s ICBC ($59.2 billion), Germany’s Mercedes-Benz ($43.9 billion), Japan’s Toyota ($43.7 billion), and Royal Dutch Shell ($39.4 billion).
After that, the remaining brands on the list are in the $4 billion to $25 billion range, including well-known names like Nestlé ($19.4 billion), Zara ($17.5 billion), and RBC ($13.8 billion). While small compared to Amazon, these are still mostly large international or national brands.
Why is Amazon so Dominant?
As Amazon continues to rapidly scale its revenue, and as the Jeff Bezos Empire expands, we are all now very familiar with the online retailer’s dominance.
That said, while Amazon appears massive on the map, it actually only just edged out Apple as the most dominant brand overall. Further, because Apple is also based in the U.S., the iconic tech company doesn’t have its logo appear on the map itself.
Here’s a look at how brand value for the top five brands has changed over time:
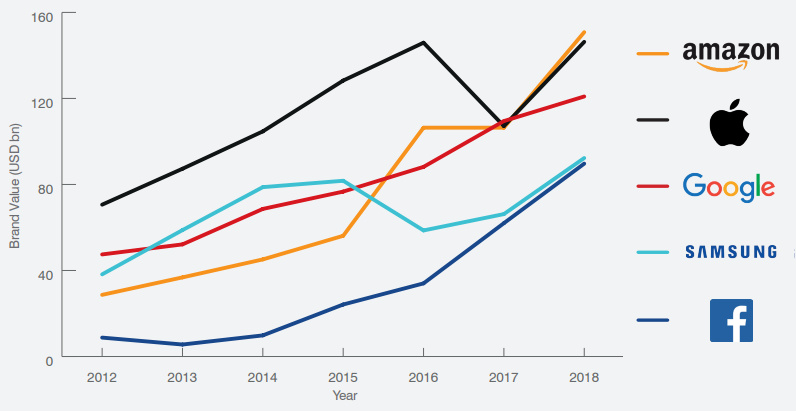
Courtesy: Brand Finance
According to Brand Finance, the value of Amazon’s brand increased by 42% between 2017 and 2018. Here’s what Brand Finance CEO, David Haigh, had to say about the future of Amazon’s brand:
The strength and value of the Amazon brand gives it stakeholder permission to extend relentlessly into new sectors and geographies. All evidence suggests that the amazing Amazon brand is going to continue growing indefinitely and exponentially.
– David Haigh, CEO of Brand Finance
Interestingly, the report authors also offer up reasons for Apple and Google getting “left behind”.
For Apple, an over-dependency on the iPhone limits the brand’s growth opportunities, while Google’s investments outside of search are unable to offer the scale, impact, or audacity demonstrated by Amazon’s ventures.
A Note on Brand Value
Understandably, there is often some confusion behind the definition of “brand value”.
Not to be confused with market capitalization or enterprise value, brand value is defined as a marketing-related intangible asset that generates economic benefits for a brand within a company. In other words, this is the value of the image of the brand itself, as represented in the minds of stakeholders.


Technology
Visualizing AI Patents by Country
See which countries have been granted the most AI patents each year, from 2012 to 2022.


Visualizing AI Patents by Country
This was originally posted on our Voronoi app. Download the app for free on iOS or Android and discover incredible data-driven charts from a variety of trusted sources.
This infographic shows the number of AI-related patents granted each year from 2010 to 2022 (latest data available). These figures come from the Center for Security and Emerging Technology (CSET), accessed via Stanford University’s 2024 AI Index Report.
From this data, we can see that China first overtook the U.S. in 2013. Since then, the country has seen enormous growth in the number of AI patents granted each year.
| Year | China | EU and UK | U.S. | RoW | Global Total |
|---|---|---|---|---|---|
| 2010 | 307 | 137 | 984 | 571 | 1,999 |
| 2011 | 516 | 129 | 980 | 581 | 2,206 |
| 2012 | 926 | 112 | 950 | 660 | 2,648 |
| 2013 | 1,035 | 91 | 970 | 627 | 2,723 |
| 2014 | 1,278 | 97 | 1,078 | 667 | 3,120 |
| 2015 | 1,721 | 110 | 1,135 | 539 | 3,505 |
| 2016 | 1,621 | 128 | 1,298 | 714 | 3,761 |
| 2017 | 2,428 | 144 | 1,489 | 1,075 | 5,136 |
| 2018 | 4,741 | 155 | 1,674 | 1,574 | 8,144 |
| 2019 | 9,530 | 322 | 3,211 | 2,720 | 15,783 |
| 2020 | 13,071 | 406 | 5,441 | 4,455 | 23,373 |
| 2021 | 21,907 | 623 | 8,219 | 7,519 | 38,268 |
| 2022 | 35,315 | 1,173 | 12,077 | 13,699 | 62,264 |
In 2022, China was granted more patents than every other country combined.
While this suggests that the country is very active in researching the field of artificial intelligence, it doesn’t necessarily mean that China is the farthest in terms of capability.
Key Facts About AI Patents
According to CSET, AI patents relate to mathematical relationships and algorithms, which are considered abstract ideas under patent law. They can also have different meaning, depending on where they are filed.
In the U.S., AI patenting is concentrated amongst large companies including IBM, Microsoft, and Google. On the other hand, AI patenting in China is more distributed across government organizations, universities, and tech firms (e.g. Tencent).
In terms of focus area, China’s patents are typically related to computer vision, a field of AI that enables computers and systems to interpret visual data and inputs. Meanwhile America’s efforts are more evenly distributed across research fields.
Learn More About AI From Visual Capitalist
If you want to see more data visualizations on artificial intelligence, check out this graphic that shows which job departments will be impacted by AI the most.

-

 Markets1 week ago
U.S. Debt Interest Payments Reach $1 Trillion
-

 Markets2 weeks ago
Ranked: The Most Valuable Housing Markets in America
-

 Money2 weeks ago
Which States Have the Highest Minimum Wage in America?
-

 AI2 weeks ago
Ranked: Semiconductor Companies by Industry Revenue Share
-

 Markets2 weeks ago
Ranked: The World’s Top Flight Routes, by Revenue
-

 Countries2 weeks ago
Population Projections: The World’s 6 Largest Countries in 2075
-

 Markets2 weeks ago
The Top 10 States by Real GDP Growth in 2023
-

 Money2 weeks ago
The Smallest Gender Wage Gaps in OECD Countries