
The Csummit is finally here - and Copenhagen is likely to be a historic moment, whatever the result.
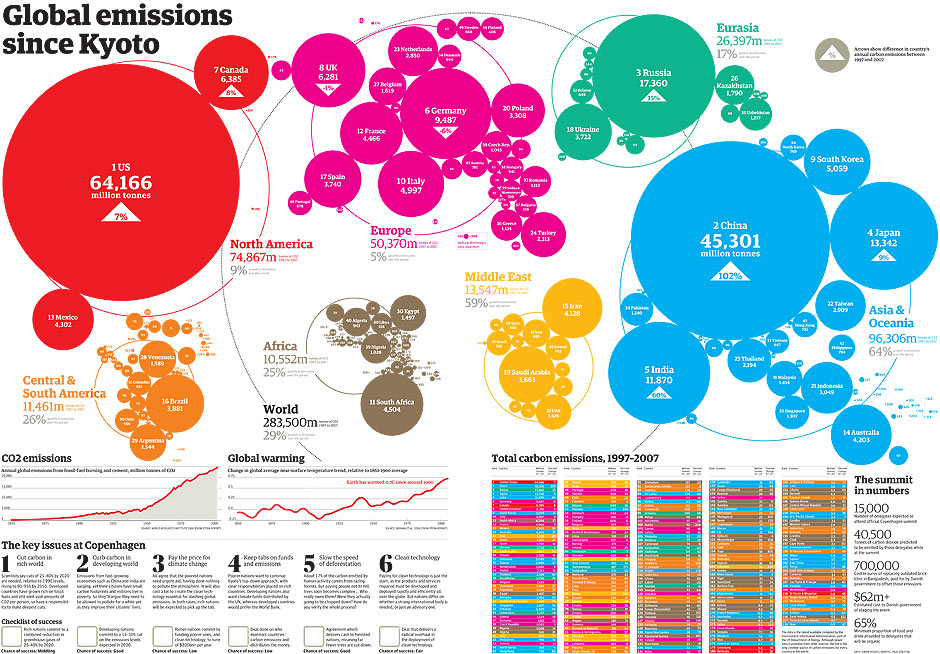
The background to the Copnehagen summit is the amount of carbon we're pumping out into the atmosphere. These are the figures, and the latest visualisation we've produced.
Which country is number one in carbon emissions? Up until very recently, it was the US - now, it is indisputedly China, as shown by this data.
These are the latest figures - up to 2007 - from the respected US Energy Information Administration. This has (literally) every country in the world on it and its emissions going back to 1980 — plus we've put on some handy percentage change data and ranking information.
The curious thing is, we've been here before. Last year we reported that China had overtaken the US in 2006. But if you look at the figures below, the change now appears to have happened in 2007. What's going on?
We asked the EIA and this is what they said:
Each year we review the underlying consumption data for petroleum, natural gas, and coal and the flaring data for natural gas and make any necessary revisions. These, in turn, affect our CO2 emissions estimates. I think that most of the change for China was due to revisions to our coal consumption data. Coal consumption is a calculated value based on production, imports, exports, and stock change and when measured in Btus is also affected by the types of coal consumed (i.e. anthracite, bituminous, and lignite). Data for the most recent year are often preliminary and most subject to revision but data for earlier years are also often revised.
Of course, these aren't all emissions - just consumption of engergy, which accounts for 60% of the total. But they give a good picture of what is going on.
Because of the interest, the EIA are going to come up with 2008 figures at the end of this year or early 2010. Then we will see exactly how fast China has grown. In the meantime, as we countdown to Copenhagen, these figures will become even more important.
Download the pdf
Carbon EmissionsWe've added in the %-change since 1990 - the Kyoto benchmark. What can you do with the numbers?
Download the full data
DATA: World emissions since 1980, by country
Can you do something with this data?
Flickr Please post your visualisations and mash-ups on our Flickr group or mail us at datastore@guardian.co.uk
• Get the A-Z of data
• More environment data
• More at the Datastore directory
• Follow us on Twitter
Summary table
|
ID
|
2007 RANK
|
2006 RANK
|
CHANGE IN RANK
|
COUNTRY/ REGION
|
2007
|
% change, 1990-07
|
Per capita emissions, 2007, tonnes
|
|---|---|---|---|---|---|---|---|
|
SOURCE: EIA |
|||||||
| 1 | North America | 7050.95 | 21.3 | 15.9 | |||
| 2 | 179 | 179 | SAME | Bermuda | 0.66 | -0.0 | 9.8 |
| 3 | 7 | 7 | SAME | Canada | 589.9 | 24.3 | 17.9 |
| 4 | 180 | 180 | SAME | Greenland | 0.63 | 10.9 | |
| 5 | 13 | 13 | SAME | Mexico | 452.96 | 49.8 | 4.2 |
| 6 | 211 | 211 | SAME | Saint Pierre and Miquelon | 0.09 | -66.1 | 12.5 |
| 7 | 2 | 1 | DOWN | United States | 6006.71 | 19.3 | 19.9 |
| 8 | Central & South America | 1193.56 | 66.5 | 2.6 | |||
| 9 | 197 | 197 | SAME | Antarctica | 0.26 | 25.4 | NA |
| 10 | 178 | 177 | DOWN | Antigua and Barbuda | 0.66 | 55.9 | 7.9 |
| 11 | 29 | 28 | DOWN | Argentina | 165.91 | 61.6 | 4.1 |
| 12 | 165 | 165 | SAME | Aruba | 1.07 | 79.3 | 10.6 |
| 13 | 123 | 122 | DOWN | Bahamas, The | 5.09 | 70.2 | 16.8 |
| 14 | 159 | 158 | DOWN | Barbados | 1.38 | 6.1 | 4.9 |
| 15 | 170 | 170 | SAME | Belize | 0.98 | 213.3 | 3.3 |
| 16 | 92 | 93 | DOWN | Bolivia | 13.54 | 167.1 | 1.4 |
| 17 | 17 | 17 | SAME | Brazil | 397.56 | 67.3 | 2.1 |
| 18 | 184 | 184 | SAME | Cayman Islands | 0.48 | 74.3 | 10.2 |
| 19 | 50 | 48 | DOWN | Chile | 64.55 | 102.0 | 4.0 |
| 20 | 51 | 52 | UP | Colombia | 64.14 | 54.6 | 1.5 |
| 21 | 114 | 114 | SAME | Costa Rica | 6.83 | 149.2 | 1.6 |
| 22 | 78 | 77 | DOWN | Cuba | 25.14 | -29.0 | 2.2 |
| 23 | 207 | 206 | DOWN | Dominica | 0.12 | 103.7 | 1.6 |
| 24 | 85 | 85 | SAME | Dominican Republic | 18.82 | 107.7 | 2.0 |
| 25 | 76 | 76 | SAME | Ecuador | 27.55 | 82.6 | 1.9 |
| 26 | 116 | 116 | SAME | El Salvador | 6.41 | 168.0 | 0.9 |
| 27 | 214 | 214 | SAME | Falkland Islands (Islas Malvinas) | 0.05 | 81.6 | NA |
| 28 | 164 | 166 | DOWN | French Guiana | 1.12 | 63.9 | NA |
| 29 | 194 | 196 | DOWN | Grenada | 0.3 | 141.8 | 3.3 |
| 30 | 151 | 152 | DOWN | Guadeloupe | 2.21 | 53.2 | NA |
| 31 | 99 | 100 | DOWN | Guatemala | 11.94 | 215.5 | 0.9 |
| 32 | 157 | 157 | SAME | Guyana | 1.62 | 140.6 | 2.1 |
| 33 | 155 | 155 | SAME | Haiti | 1.82 | 144.9 | 0.2 |
| 34 | 109 | 108 | DOWN | Honduras | 7.85 | 188.0 | 1.0 |
| 35 | 94 | 95 | DOWN | Jamaica | 13.09 | 73.7 | 4.7 |
| 36 | 147 | 147 | SAME | Martinique | 2.46 | 56.7 | NA |
| 37 | 212 | 212 | SAME | Montserrat | 0.08 | 120.9 | 18.5 |
| 38 | 97 | 98 | DOWN | Netherlands Antilles | 12.46 | 27.8 | 55.7 |
| 39 | 124 | 125 | DOWN | Nicaragua | 4.85 | 141.2 | 0.9 |
| 40 | 89 | 89 | SAME | Panama | 14.78 | 25.3 | 4.5 |
| 41 | 133 | 133 | SAME | Paraguay | 3.83 | 74.3 | 0.6 |
| 42 | 74 | 74 | SAME | Peru | 32.42 | 61.3 | 1.1 |
| 43 | 71 | 71 | SAME | Puerto Rico | 36.57 | 80.8 | 9.3 |
| 44 | 202 | 203 | DOWN | Saint Kitts and Nevis | 0.2 | 196.2 | 5.0 |
| 45 | 187 | 187 | SAME | Saint Lucia | 0.38 | 129.7 | 2.4 |
| 46 | 201 | 201 | SAME | Saint Vincent/Grenadines | 0.2 | 154.5 | 1.9 |
| 47 | 152 | 153 | DOWN | Suriname | 2.07 | 37.4 | 4.4 |
| 48 | 62 | 62 | SAME | Trinidad and Tobago | 47.03 | 158.6 | 38.1 |
| 49 | 217 | 216 | DOWN | Turks and Caicos Islands | 0.01 | 0.6 | |
| 50 | 110 | 111 | DOWN | Uruguay | 7.5 | 66.6 | 2.2 |
| 51 | 27 | 31 | UP | Venezuela | 171.67 | 56.4 | 6.6 |
| 52 | 88 | 87 | DOWN | Virgin Islands, U.S. | 16.48 | 121.0 | 150.0 |
| 53 | 210 | 209 | DOWN | Virgin Islands, British | 0.1 | 104.2 | 4.4 |
| 54 | Europe | 4690.43 | 2.5 | 7.9 | |||
| 55 | 125 | 126 | DOWN | Albania | 4.65 | -23.8 | 1.3 |
| 56 | 46 | 47 | UP | Austria | 72.74 | 30.3 | 8.9 |
| 57 | 33 | 32 | DOWN | Belgium | 144.16 | 14.7 | 13.9 |
| 58 | 84 | 82 | DOWN | Bosnia and Herzegovina | 18.87 | 4.1 | |
| 59 | 61 | 58 | DOWN | Bulgaria | 50.63 | -33.8 | 6.9 |
| 60 | 77 | 78 | DOWN | Croatia | 25.38 | 5.6 | |
| 61 | 105 | 104 | DOWN | Cyprus | 9.54 | 87.4 | 9.1 |
| 62 | 38 | 39 | UP | Czech Republic | 103.24 | 10.1 | |
| 63 | 55 | 53 | DOWN | Denmark | 57.05 | -0.5 | 10.4 |
| 64 | 174 | 173 | DOWN | Faroe Islands | 0.8 | 16.5 | |
| 65 | 53 | 55 | UP | Finland | 57.53 | 7.7 | 11.0 |
| 66 | Former Czechoslovakia | -- | -- | ||||
| 67 | 69 | 66 | DOWN | Former Serbia and Montenegro | 38.97 | -3.9 | 3.9 |
| 68 | Former Yugoslavia | -- | -- | ||||
| 69 | 16 | 15 | DOWN | France | 405.06 | -2.9 | 6.4 |
| 70 | 6 | 6 | SAME | Germany | 835.13 | -2.2 | 10.1 |
| 71 | Germany, East | -- | -- | ||||
| 72 | Germany, West | -- | -- | ||||
| 73 | 128 | 128 | SAME | Gibraltar | 4.55 | 1.5 | 159.1 |
| 74 | 36 | 36 | SAME | Greece | 107.86 | 1.8 | 10.1 |
| 75 | 56 | 54 | DOWN | Hungary | 57 | -2.8 | 5.7 |
| 76 | 134 | 134 | SAME | Iceland | 3.49 | 3.7 | 11.6 |
| 77 | 64 | 63 | DOWN | Ireland | 44.74 | -2.6 | 10.9 |
| 78 | 11 | 11 | SAME | Italy | 460.8 | -1.7 | 7.9 |
| 79 | 98 | 96 | DOWN | Luxembourg | 12.18 | -2.3 | 25.4 |
| 80 | 107 | 107 | SAME | Macedonia | 8.35 | 4.5 | 4.1 |
| 81 | 136 | 138 | DOWN | Malta | 3.1 | 5.3 | 7.7 |
| 82 | 185 | 185 | SAME | Montenegro | 0.46 | 3.8 | -- |
| 83 | 24 | 23 | DOWN | Netherlands | 261.46 | -5.4 | 15.8 |
| 84 | 66 | 67 | DOWN | Norway | 42.31 | 5.6 | 9.1 |
| 85 | 22 | 20 | DOWN | Poland | 301.71 | 0.1 | 7.8 |
| 86 | 52 | 51 | DOWN | Portugal | 61.13 | -0.8 | 5.7 |
| 87 | 39 | 38 | DOWN | Romania | 103.12 | 2.6 | 4.6 |
| 88 | 93 | 91 | DOWN | Serbia | 13.51 | 1.1 | -- |
| 89 | 70 | 72 | DOWN | Slovakia | 38.52 | 1.8 | 7.1 |
| 90 | 87 | 86 | DOWN | Slovenia | 17.28 | -1.0 | 8.6 |
| 91 | 18 | 18 | SAME | Spain | 383.21 | 1.7 | 9.5 |
| 92 | 57 | 56 | DOWN | Sweden | 56.86 | 0.1 | 6.3 |
| 93 | 65 | 64 | DOWN | Switzerland | 43.81 | -3.7 | 5.8 |
| 94 | 23 | 24 | UP | Turkey | 277.2 | 10.1 | 3.7 |
| 95 | 8 | 8 | SAME | United Kingdom | 564.02 | -3.8 | 9.3 |
| 96 | Eurasia | 2609.01 | 0.9 | 9.2 | |||
| 97 | 101 | 101 | SAME | Armenia | 11.22 | 8.4 | 3.8 |
| 98 | 73 | 68 | DOWN | Azerbaijan | 35.69 | -10.9 | 4.4 |
| 99 | 48 | 50 | UP | Belarus | 68.55 | 3.2 | 7.0 |
| 100 | 80 | 84 | DOWN | Estonia | 21.28 | 13.5 | 16.2 |
| 101 | Former U.S.S.R. | -- | -- | ||||
| 102 | 121 | 124 | DOWN | Georgia | 5.56 | 13.6 | 1.2 |
| 103 | 26 | 26 | SAME | Kazakhstan | 216.4 | 1.9 | 14.2 |
| 104 | 118 | 119 | DOWN | Kyrgyzstan | 5.68 | 3.4 | 1.1 |
| 105 | 104 | 105 | DOWN | Latvia | 9.78 | 5.5 | 4.3 |
| 106 | 86 | 88 | DOWN | Lithuania | 17.63 | 6.5 | 4.9 |
| 107 | 108 | 109 | DOWN | Moldova | 7.86 | 3.0 | 1.8 |
| 108 | 3 | 3 | SAME | Russia | 1672.62 | -0.4 | 11.8 |
| 109 | 115 | 110 | DOWN | Tajikistan | 6.77 | -9.6 | 1.0 |
| 110 | 59 | 61 | UP | Turkmenistan | 53.13 | 6.3 | 11.1 |
| 111 | 19 | 19 | SAME | Ukraine | 354.39 | 5.4 | 7.7 |
| 112 | 35 | 35 | SAME | Uzbekistan | 122.46 | 1.4 | 4.5 |
| 113 | Middle East | 1569.38 | 4.6 | 8.0 | |||
| 114 | 75 | 75 | SAME | Bahrain | 29.11 | 4.6 | 41.0 |
| 115 | 10 | 10 | SAME | Iran | 490.29 | 3.0 | 7.5 |
| 116 | 41 | 41 | SAME | Iraq | 95.91 | 4.4 | 3.5 |
| 117 | 49 | 49 | SAME | Israel | 68.41 | -0.5 | 9.8 |
| 118 | 81 | 81 | SAME | Jordan | 21.07 | 5.1 | 3.5 |
| 119 | 43 | 44 | UP | Kuwait | 78.49 | 1.5 | 31.3 |
| 120 | 90 | 90 | SAME | Lebanon | 13.86 | 3.4 | 3.5 |
| 121 | 72 | 73 | DOWN | Oman | 36.35 | 2.2 | 11.3 |
| 122 | 139 | 140 | DOWN | Palestine | 3 | 3.6 | 0.8 |
| 123 | 54 | 57 | UP | Qatar | 57.51 | 3.3 | 70.6 |
| 124 | 15 | 16 | UP | Saudi Arabia | 433.93 | 6.8 | 15.7 |
| 125 | 60 | 60 | SAME | Syria | 51.03 | -0.1 | 2.5 |
| 126 | 28 | 29 | UP | United Arab Emirates | 170.92 | 10.0 | 38.5 |
| 127 | 83 | 83 | SAME | Yemen | 19.51 | 2.8 | 0.9 |
| 128 | Africa | 1090.89 | 2.3 | 1.2 | |||
| 129 | 40 | 40 | SAME | Algeria | 100.95 | 6.6 | 3.0 |
| 130 | 79 | 80 | DOWN | Angola | 22.1 | 3.9 | 1.8 |
| 131 | 137 | 137 | SAME | Benin | 3.04 | 1.0 | 0.4 |
| 132 | 129 | 127 | DOWN | Botswana | 4.47 | -1.9 | 2.3 |
| 133 | 161 | 161 | SAME | Burkina Faso | 1.27 | 1.8 | 0.1 |
| 134 | 188 | 188 | SAME | Burundi | 0.38 | 5.6 | 0.0 |
| 135 | 111 | 112 | DOWN | Cameroon | 7.48 | 1.7 | 0.4 |
| 136 | 195 | 194 | DOWN | Cape Verde | 0.29 | 0.8 | 0.7 |
| 137 | 189 | 189 | SAME | Central African Republic | 0.34 | 4.4 | 0.1 |
| 138 | 198 | 199 | DOWN | Chad | 0.24 | 8.2 | 0.0 |
| 139 | 206 | 207 | DOWN | Comoros | 0.12 | 4.4 | 0.2 |
| 140 | 120 | 118 | DOWN | Congo (Brazzaville) | 5.6 | 0.7 | 1.5 |
| 141 | 148 | 146 | DOWN | Congo (Kinshasa) | 2.41 | -2.6 | 0.0 |
| 142 | 113 | 115 | DOWN | Cote dIvoire (IvoryCoast) | 6.85 | 7.3 | 0.3 |
| 143 | 156 | 156 | SAME | Djibouti | 1.76 | 4.7 | 2.5 |
| 144 | 30 | 30 | SAME | Egypt | 159.81 | 4.6 | 2.1 |
| 145 | 127 | 123 | DOWN | Equatorial Guinea | 4.56 | -7.0 | 7.6 |
| 146 | 176 | 176 | SAME | Eritrea | 0.77 | 2.8 | 0.1 |
| 147 | 122 | 121 | DOWN | Ethiopia | 5.35 | 3.8 | 0.1 |
| 148 | 130 | 129 | DOWN | Gabon | 4.31 | -3.6 | 3.0 |
| 149 | 191 | 190 | DOWN | Gambia, The | 0.34 | 3.4 | 0.2 |
| 150 | 112 | 113 | DOWN | Ghana | 6.97 | 4.3 | 0.3 |
| 151 | 158 | 159 | DOWN | Guinea | 1.41 | 2.6 | 0.1 |
| 152 | 186 | 186 | SAME | Guinea-Bissau | 0.41 | 6.1 | 0.3 |
| 153 | 100 | 99 | DOWN | Kenya | 11.68 | 3.2 | 0.3 |
| 154 | 199 | 198 | DOWN | Lesotho | 0.24 | 3.0 | 0.1 |
| 155 | 181 | 181 | SAME | Liberia | 0.62 | 1.4 | 0.2 |
| 156 | 58 | 59 | UP | Libya | 53.88 | 2.7 | 8.9 |
| 157 | 146 | 145 | DOWN | Madagascar | 2.6 | 4.3 | 0.1 |
| 158 | 168 | 169 | DOWN | Malawi | 1.05 | 3.4 | 0.1 |
| 159 | 177 | 178 | DOWN | Mali | 0.7 | 6.8 | 0.1 |
| 160 | 140 | 141 | DOWN | Mauritania | 2.91 | 2.8 | 1.0 |
| 161 | 131 | 131 | SAME | Mauritius | 4.18 | 2.9 | 3.3 |
| 162 | 68 | 70 | DOWN | Morocco | 39.06 | 2.2 | 1.3 |
| 163 | 150 | 142 | DOWN | Mozambique | 2.3 | -17.6 | 0.1 |
| 164 | 138 | 139 | DOWN | Namibia | 3.03 | 4.6 | 1.5 |
| 165 | 162 | 162 | SAME | Niger | 1.27 | 2.0 | 0.1 |
| 166 | 37 | 37 | SAME | Nigeria | 103.47 | 0.3 | 0.7 |
| 167 | 142 | 143 | DOWN | Reunion | 2.78 | 1.4 | NA |
| 168 | 171 | 171 | SAME | Rwanda | 0.86 | 3.1 | 0.1 |
| 169 | 216 | 217 | DOWN | Saint Helena | 0.01 | 25.4 | 1.9 |
| 170 | 208 | 208 | SAME | Sao Tome and Principe | 0.11 | 3.4 | 0.6 |
| 171 | 117 | 117 | SAME | Senegal | 5.88 | -0.4 | 0.5 |
| 172 | 169 | 163 | DOWN | Seychelles | 1.03 | -13.8 | 12.1 |
| 173 | 163 | 164 | DOWN | Sierra Leone | 1.18 | 3.3 | 0.2 |
| 174 | 175 | 174 | DOWN | Somalia | 0.79 | 3.7 | 0.1 |
| 175 | 14 | 12 | DOWN | South Africa | 452.28 | 1.4 | 9.4 |
| 176 | 96 | 97 | DOWN | Sudan | 12.47 | 0.7 | 0.3 |
| 177 | 167 | 167 | SAME | Swaziland | 1.05 | -2.7 | 0.8 |
| 178 | 119 | 120 | DOWN | Tanzania | 5.68 | 3.8 | 0.1 |
| 179 | 144 | 148 | DOWN | Togo | 2.62 | 12.4 | 0.5 |
| 180 | 82 | 79 | DOWN | Tunisia | 20.26 | -4.8 | 2.0 |
| 181 | 154 | 154 | SAME | Uganda | 1.93 | 0.9 | 0.1 |
| 182 | 196 | 195 | DOWN | Western Sahara | 0.28 | 5.7 | 0.7 |
| 183 | 145 | 144 | DOWN | Zambia | 2.6 | 1.3 | 0.2 |
| 184 | 102 | 102 | SAME | Zimbabwe | 10.83 | 6.4 | 0.9 |
| 185 | Asia & Oceania | 11710.01 | 6.1 | 3.2 | |||
| 186 | 172 | 175 | DOWN | Afghanistan | 0.83 | 8.9 | 0.0 |
| 187 | 182 | 182 | SAME | American Samoa | 0.61 | 1.4 | 9.5 |
| 188 | 12 | 14 | UP | Australia | 456.36 | 9.2 | 22.0 |
| 189 | 63 | 65 | UP | Bangladesh | 45.56 | 5.2 | 0.3 |
| 190 | 192 | 191 | DOWN | Bhutan | 0.32 | 1.4 | 0.5 |
| 191 | 103 | 103 | SAME | Brunei | 10.2 | 3.5 | 27.2 |
| 192 | 91 | 94 | DOWN | Burma (Myanmar) | 13.66 | 7.3 | 0.3 |
| 193 | 132 | 132 | SAME | Cambodia | 3.92 | 1.7 | 0.3 |
| 194 | 1 | 2 | UP | China | 6283.56 | 7.2 | 4.8 |
| 195 | 213 | 213 | SAME | Cook Islands | 0.08 | 1.0 | 5.9 |
| 196 | 143 | 150 | DOWN | Fiji | 2.71 | 17.7 | 2.9 |
| 197 | 166 | 168 | DOWN | French Polynesia | 1.05 | 3.0 | 3.8 |
| 198 | 153 | 151 | DOWN | Guam | 2.06 | -8.6 | 11.9 |
| 199 | Hawaiian Trade Zone | -- | -- | ||||
| 200 | 42 | 43 | UP | Hong Kong | 82.93 | 3.0 | 11.9 |
| 201 | 4 | 4 | SAME | India | 1400.71 | 8.7 | 1.2 |
| 202 | 20 | 22 | UP | Indonesia | 318.54 | 9.5 | 1.4 |
| 203 | 5 | 5 | SAME | Japan | 1262.39 | 0.7 | 9.9 |
| 204 | 215 | 215 | SAME | Kiribati | 0.04 | 7.4 | 0.4 |
| 205 | 47 | 45 | DOWN | Korea, North | 69.44 | -9.2 | 3.1 |
| 206 | 9 | 9 | SAME | Korea, South | 515.98 | 6.1 | 10.7 |
| 207 | 183 | 183 | SAME | Laos | 0.6 | 2.7 | 0.1 |
| 208 | 149 | 149 | SAME | Macau | 2.35 | 2.2 | 4.5 |
| 209 | 31 | 27 | DOWN | Malaysia | 157.71 | -0.8 | 6.4 |
| 210 | 173 | 172 | DOWN | Maldives | 0.81 | -2.0 | 2.2 |
| 211 | 106 | 106 | SAME | Mongolia | 9.09 | 6.0 | 3.1 |
| 212 | 204 | 204 | SAME | Nauru | 0.19 | 7.2 | 13.7 |
| 213 | 135 | 135 | SAME | Nepal | 3.42 | 7.9 | 0.1 |
| 214 | 141 | 136 | DOWN | New Caledonia | 2.8 | -7.1 | 12.6 |
| 215 | 67 | 69 | DOWN | New Zealand | 39.23 | -2.0 | 9.5 |
| 216 | 218 | 218 | SAME | Niue | 0 | -2.1 | NA |
| 217 | 34 | 34 | SAME | Pakistan | 138.4 | 2.1 | 0.8 |
| 218 | 126 | 130 | DOWN | Papua New Guinea | 4.59 | 6.8 | 0.8 |
| 219 | 45 | 46 | UP | Philippines | 76.09 | 1.5 | 0.8 |
| 220 | 205 | 205 | SAME | Samoa | 0.18 | 8.6 | 0.8 |
| 221 | 32 | 33 | UP | Singapore | 154.17 | 10.0 | 33.9 |
| 222 | 200 | 200 | SAME | Solomon Islands | 0.22 | 13.4 | 0.4 |
| 223 | 95 | 92 | DOWN | Sri Lanka | 13.07 | 2.0 | 0.6 |
| 224 | 21 | 21 | SAME | Taiwan | 307.89 | 3.1 | 13.5 |
| 225 | 25 | 25 | SAME | Thailand | 248.15 | 4.4 | 3.8 |
| 226 | 190 | 192 | DOWN | Timor-Leste (East Timor) | 0.34 | 9.0 | 0.3 |
| 227 | 203 | 202 | DOWN | Tonga | 0.19 | 6.5 | 1.7 |
| 228 | 193 | 193 | SAME | U.S. Pacific Islands | 0.3 | 0.5 | 1.2 |
| 229 | 209 | 210 | DOWN | Vanuatu | 0.1 | 7.1 | 0.5 |
| 230 | 44 | 42 | DOWN | Vietnam | 77.88 | -6.3 | 0.9 |
| 231 | 160 | 160 | SAME | Wake Island | 1.28 | 1.1 | NA |
| 232 | World | 29914.24 | 3.1 | 4.5 | |||
