


Abstract
Cultivation of corn and soybeans in the United States reached record high levels following the biofuels boom of the late 2000s. Debate exists about whether the expansion of these crops caused conversion of grasslands and other carbon-rich ecosystems to cropland or instead replaced other crops on existing agricultural land. We tracked crop-specific expansion pathways across the conterminous US and identified the types, amount, and locations of all land converted to and from cropland, 2008–2012. We found that crop expansion resulted in substantial transformation of the landscape, including conversion of long-term unimproved grasslands and land that had not been previously used for agriculture (cropland or pasture) dating back to at least the early 1970s. Corn was the most common crop planted directly on new land, as well as the largest indirect contributor to change through its displacement of other crops. Cropland expansion occurred most rapidly on land that is less suitable for cultivation, raising concerns about adverse environmental and economic costs of conversion. Our results reveal opportunities to increase the efficacy of current federal policy conservation measures by modifying coverage of the 2014 US Farm Bill Sodsaver provision and improving enforcement of the US Renewable Fuels Standard.
Export citation and abstract BibTeX RIS

Content from this work may be used under the terms of the Creative Commons Attribution 3.0 licence. Any further distribution of this work must maintain attribution to the author(s) and the title of the work, journal citation and DOI.
1. Introduction
New federal policies, changes to commodity markets, and increased demand for biofuels have created a new era of agriculture in the United States [1, 2]. Corn and soybeans now dominate the landscape as the two largest crops by area, with corn reaching its highest level since 1932 and soybeans at an all-time high [3]. Substantial debate exists in the literature about whether the recent expansion of these crops caused conversion of grasslands into cropland or instead replaced other crops on existing cultivated areas [4–6]. Concern has grown over potential conversion due to the loss of habitat and biodiversity [7, 8], increased soil erosion and water pollution [9, 10], and net release of carbon dioxide to the atmosphere typically associated with changes from grassland to cropland [11, 12].
Any consequential cropland expansion may also signify problems in current biofuel and agricultural policy frameworks [13–17]. In general, these policies include measures to avoid new conversion of land; however, mounting evidence suggests it may still be occurring, despite the previous 30-year trend of cropland area decline [18–20]. In fact, if nationwide conversion of grasslands and habitat is as high as some regional studies indicate, the US landscape may be experiencing the greatest transformation to cropland since the 'fencerow-to-fencerow' era of the 1970s and the Dust Bowl of the 1930s prior [4].
In order to reduce this land conversion and its associated impacts, the recent federal Farm Bill (Agricultural Act of 2014) included a 'Sodsaver' provision to decrease crop insurance subsidy incentives for converting previously-uncultivated land. However, the enacted provision covers only six states surrounding the Prairie Pothole Region of the Northern Great Plains, a well-studied habitat where high levels of conversion had previously been detected [4, 21, 22]. Due to the recent nature of this policy intervention, its efficacy and geographic coverage have yet to be tested.
The US Renewable Fuels Standard (RFS2) also contains protections to prevent land-use change and its associated greenhouse gas emissions. The standard, which mandates renewable fuels be blended into the transportation fuel supply, explicitly excludes from qualifying for renewable credits any feedstocks sourced from land converted to cropland after 2007 [23]. To monitor this regulation, the US Environmental Protection Agency (EPA) relies on nationally-aggregated measures of total cropland from the Department of Agriculture's Farm Service Agency (FSA) and National Agricultural Statistics Service (NASS). These aggregate indicators are incomplete, however, as they report only net changes in cropland area, and thus mask gross cropland expansion and abandonment such that even rapidly evolving landscapes can appear static. Furthermore, it is not possible to identify the land sources being converted or types of cropland expanding because these data are not spatially explicit.
Despite the widespread implications for conservation and federal policies, cropland dynamics at the national scale have not been comprehensively assessed. Regional satellite-based studies have shown that the increased corn and soy area caused significant conversion of grasslands and wetlands in the Western Corn Belt and Northern Plains [4, 21, 24]. Other studies in Iowa and the Central US found that production has expanded onto uncultivated land as well as replaced other types of crops [25, 26]. At sub-national levels, however, study boundary choices often influence outcomes, and alternative analyses can suggest differing trends [5, 6, 27]. Further, many satellite analyses take a 'bi-temporal snapshot' approach, that is, they compare data between two isolated points in time and disregard intermediate-year data [4, 28, 29]. This bi-temporal methodology does not capture the regular rotation of lands into and out of cultivation, thereby potentially inflating reported rates of conversion. In addition, improvements to the input data over time have not always been considered and may have biased previous results (see supplementary methods, available at stacks.iop.org/ERL/10/044003/mmedia).
To overcome these limitations, we performed a multi-year, spatially-explicit analysis of cropland changes across the conterminous United States. We tracked net and gross changes between cropland and non-cropland from 2008–2012, the time period immediately following passage of the RFS, and identified areas of no change, conversions to and from cropland, and land in frequent rotation between crop and non-crop uses. Data from the satellite-derived USDA cropland data layer (CDL) [30] were used in combination with historical land cover information from the Multi-Resolution Land Characteristics Consortium's National Land Cover Database (NLCD) [31] and the United States Geological Survey's (USGS) Land Cover Trends Dataset [32] to identify long-term patterns of cultivation and the types of land being converted to and from cropland. We developed a trajectory-based methodology to integrate all available data, including intermediate years, and used advanced spatiotemporal processing to ensure consistency across land cover products, time, and geographic boundaries. Methods were validated against best available data recently released from the USDA NASS and FSA.
2. Methods
2.1. Mapping land conversions
Five years of data from the CDL, a crop-specific land cover map, were used to identify multi-year trends in cultivation, 2008–2012. All CDL land cover categories were first consolidated into two broad categories—crop and non-crop (supplementary table S1)—for the initial detection of conversion. Data from each year were then stacked and combined into a single point that represented one of the 32 possible five-year combinations of crop or non-crop. These new data, referred to as trajectories, represented unique temporal patterns of cultivation over the study period.
To account for noise in the original data, a spatial filter and minimum mapping unit were applied to the trajectories based on calibration with ground-based data from the USDA FSA (see supplementary methods). Temporal classification was then used to further refine the data and identify areas of stable cropland, intermittent cropland, and one-way, one-time conversions. As a result, only areas of at least 15 acres in size and that displayed a consistent, unidirectional trend in cultivation were considered potential conversions.
Estimates of cropland expansion were further refined using the NLCD to remove any areas that were classified as cultivated cropland in either 2001 or 2006. This helped distinguish conversions from long-term rotations by ensuring that new croplands had not been cultivated for at least three observations dating back to 2001. In addition, it served to identify croplands that may have been missed in early years of the CDL, and thus removed artificial change caused by the improvement of the CDL over time (see supplementary methods).
2.2. Identifying sources of converted land
Our definitions of grasslands and other non-crop categories were based on remote-sensing capabilities and thus included retired croplands planted to permanent vegetative cover through the Conservation Reserve Program (CRP), a federal program that pays farmers to set aside environmentally-sensitive land for periods of 10–15 years [33]. We measured the maximum amount of land that could have come from the CRP during the study period using gross county-level enrollment data from the FSA.
Although current remote-sensing products are unable to discern native from non-native vegetation, longer-term land cover data can identify areas that have been uncultivated for decades and thus most likely to contain undisturbed soil. We created a nationwide map of converted long-term, unimproved grasslands using the 1992, 2001, and 2006 NLCD to exclude recently converted areas that were previously cultivated crops or planted pasture/hay, thus removing planted and improved grasslands and leaving only those likely to have not been planted, plowed, nor hayed for at least 20 years. This step differed from our previous use of the NLCD in that this application considered both a longer time period and additional class restrictions to identify a smaller subset of conversion.
We also used original data spanning 1972–2002 from the USGS's recent long-term trends analysis to estimate the percent of new cropland that had not been previously used for intensive agriculture (cropland or pasture) [18, 32]. The dataset includes 2688 sample blocks randomly selected from both uncultivated areas and intensive agriculture across 84 EPA Level III ecoregions of the US. Most blocks were 10 km by 10 km in size, with a collective coverage area of 73 million acres. These blocks were used to identify locations that had never been classified as agriculture in any of the five annual groupings of data circa 1973, 1980, 1986, 1992, and 2000. Sampled conversion rates were then aggregated at the ecoregion level to estimate total conversion from previously uncultivated areas, with state-level estimates derived from a weighted average of coinciding ecoregions.
2.3. Calculating individual crop contributions
Quantitatively understanding the contribution of specific crops to total expansion is useful for allocating land use in life cycle analyses of bio-based goods and services. We allocated land conversion responsibility to specific crops by assuming that new conversion was proportional to a crop's change in area. Only crops that experienced a net increase in area were assigned responsibility for cropland expansion. Crops unchanged in area were not considered responsible for conversion, and crops that experienced a net decline were assigned responsibility for abandonment. This approach, though based on the assumption that cropland varies only in response to crop areas, offers a consistent method to account for all new conversion while allowing necessary flexibilities for rotations and displacement.
2.4. Assessing the quality of converted land
The agricultural quality of converted areas was identified using the Natural Resource Conservation Service's (NRCS) land capability classification (LCC) system. We grouped and referred to land characterized by slight to moderate cultivation limitations as prime (LCC 1-2), land characterized by severe to very severe limitations as marginal (LCC 3-4), and land with limitations that restrict use to non-crop purposes as unsuitable (LCC 5-8), with the understanding that these terms may take on other definitions elsewhere in the literature. Sources and end uses of converted land were identified using annual CDL layers processed under the same parameters as the rest of the analysis.
2.5. Estimating carbon emissions
Lastly, bounding estimates for carbon dioxide emissions from corn and soy expansion were calculated using established literature values. Low and high values were respectively based on estimates for previously-cultivated CRP reverted to cropland under permanent no-till management [12] and intact central grasslands converted to annual crops using traditional tillage [11]. For the most likely estimate, we applied the distribution of low and high carbon values according to representative ratios identified in our results and assumed the maximum possible contribution from CRP (see supplementary methods).
3. Results
3.1. Location and area of cropland conversions, 2008–2012
Total net cropland area increased by 2.98 million acres nationwide from 2008 to 2012. Gross land conversion was nearly four times greater than the net change, highlighting the importance of going beyond aggregate-type data. Of the gross change, 7.34 million acres of land uncultivated since at least 2001 were converted to crop production 2008–2012. In the same four years, approximately 4.36 million acres of existing cropland were abandoned or otherwise removed from production, most of which (up to 85%) was newly enrolled into the CRP.
Excluding converted lands, there were 281 million acres of stable, active cropland, which includes all traditional row and closely-planted crops, tree crops, and annual fallow land. We also found an additional 9.4 million acres of intermittent croplands, defined as land cultivated at least two of the seven years among 2001, 2006, and 2008–2012. Intermittent croplands did not undergo a one-way, one-time conversion to or from cropland, but instead represented a lower-frequency use of land for crop production. This distinct category—separate from both stable cropland and conversions—accommodates the crop-pasture rotations and annual fluctuations in planted area that often confound other analyses.
Substantial geographic variation exists in the distribution of cropland conversions, with clear 'hotspots' of change both to and from cropland (figure 1, supplementary figures S1 and S2). In the US Corn Belt (supplementary figure S3) South Dakota and North Dakota experienced the greatest amount of new cultivation (supplementary table S2). Here, expansion occurred primarily east of the Missouri river, especially concentrated in the Prairie Pothole Region, reinforcing the importance of previous studies focused on this region [12, 13].
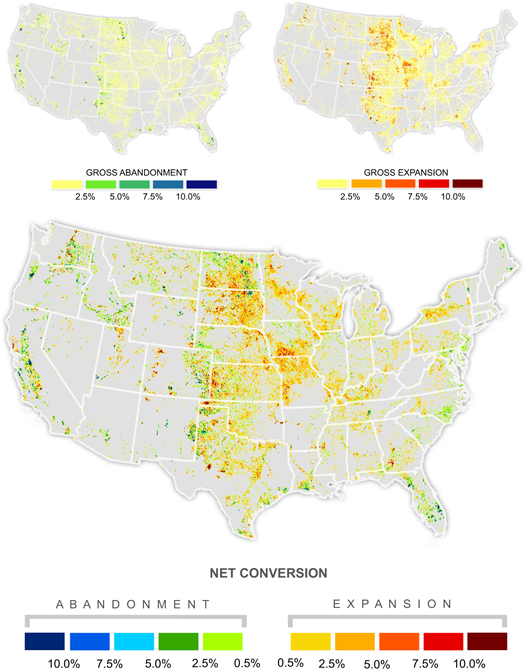
Figure 1. Estimate of net conversion to and from cropland from trajectory analysis of the cropland data layer 2008–2012. Amount of net conversion is displayed as the percent of the landscape that was converted to or from cropland from 2008 to 2012, aggregated to 5.6 km pixels for display.
Download figure:
Standard image High-resolution imageCroplands also substantially infilled the lesser-cultivated areas of Southern Iowa and Northern Missouri, a region characterized by steeply sloped hills normally reserved for livestock grazing. In western Kansas and the panhandles of Oklahoma and Texas, we found highly concentrated expansion hotspots, many of which are indicative of new, center-pivot irrigated fields (supplementary figure S4). Located above the rapidly-depleting Ogallala aquifer, cropland expansion in this region raises substantial concerns about water use and sustainability [34, 35].
Cropland abandonment also varied spatially across the US, but in general lacked the strong regional patterns of expansion. Instead, small concentrated patches of cropland loss were scattered across a landscape of low converted area (supplementary figure S2). Locations of highest abandonment also had high levels of expansion, resulting in hotbeds of activity in both directions.
Observing the location of new cropland relative to existing cropland highlights where crops are expanding outside their typical range and extent. In particular, the perimeters of the Appalachians, Ozarks, and the Northwoods of Minnesota all experienced relative rates of cropland expansion greater than 100% (figure 2), signifying that the amount of cropland has more than doubled. As croplands continue to expand into these new frontiers, the direct tradeoffs between agricultural production and nature are likely to intensity [36, 37].
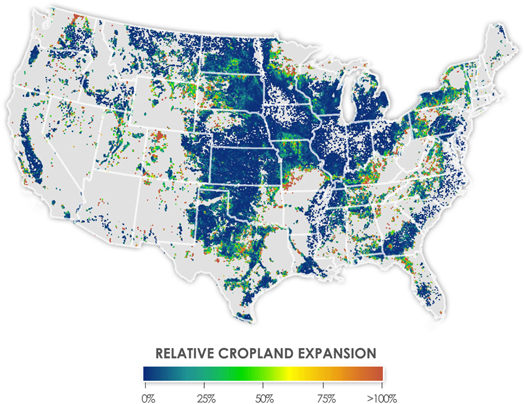
Figure 2. Relative Cropland Expansion. Map represents the amount of new cropland expansion relative to cropland extent in 2008. Areas in red are hotspots where the amount of cropland more than doubled between 2008 and 2012. Mapping relative expansion illuminates the 'new frontiers' of agriculture, or locations where cultivation is rapidly encroaching into areas previously reserved for other uses. Map made by dividing gross expansion (aggregated to 560 m) by the average amount of existing cropland within a 10 × 10 km local region.
Download figure:
Standard image High-resolution image3.2. Land sources of recently converted cropland
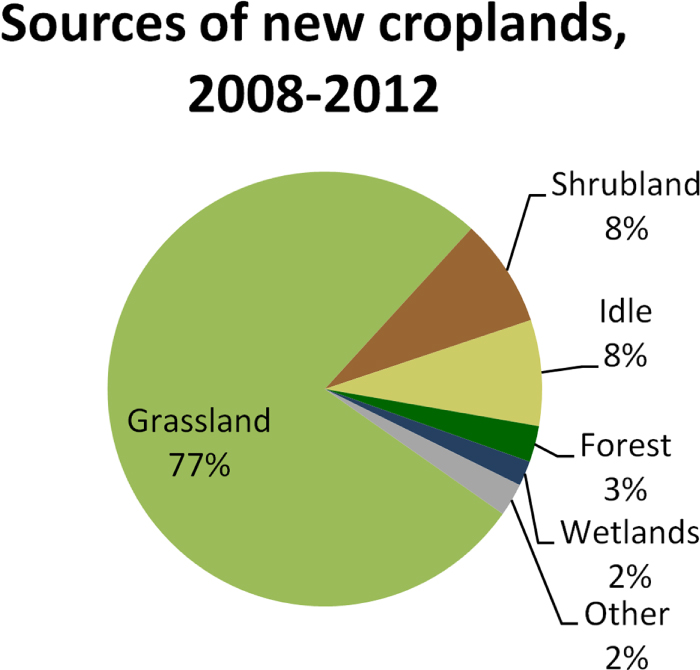
From 2008 to 2012, grasslands were the source for 77% of all new croplands, with 5.7 million acres converted. This accounting includes both native and planted grasslands, as well as those that may have been used for pasture or hay. Shrubland (8%) and long-term (10 + year) idle land (8%) were the next most common land types converted to cropland, followed by forested areas (3%) and wetlands (2%) (figure 3). The majority of the 198 000 acres of forest conversion occurred in the eastern US (supplementary figure S5 and supplementary table S3), while the 136 000 acres of converted wetlands were most concentrated in Minnesota and the Dakotas (supplementary figure S6 and supplementary table S4).

Figure 3. Types of land converted to crop production. Grasslands were the most common land cover to be converted to cropland, followed by shrubland and long term (10+ year) idle land.
Download figure:
Standard image High-resolution imageAcreage exiting the CRP is often considered a major source of land available for expanding active cultivated area. From 2008 to 2012, total CRP enrollment declined by 5.1 million acres (supplementary table S5). However, the geospatial distribution of land exiting the program shows it could account for a maximum of 3 million of the 7.3 million acres of expanded cropland over the study period. This suggests at least 4.3 million acres (58%) of the identified conversion to cropland necessarily came from other sources (supplementary figure S7).
Distinguishing long-term grasslands from other types of converted land is of high interest due to the elevated amounts of stored soil carbon and diverse native species these areas can often contain [39, 40]. We found 1.6 million acres of long-term (20 + year) unimproved grasslands were transformed to cropland during our recent four-year study period. Thus, over a quarter of converted grasslands and 22% of all land converted to crop production came from these longstanding prairie- and range-like locations. Much of this transformation was in the Central Plains stretching longitudinally from North Dakota to Texas (supplementary figure S8), mimicking the land change that contributed to the Dust Bowl of the 1930s [41].
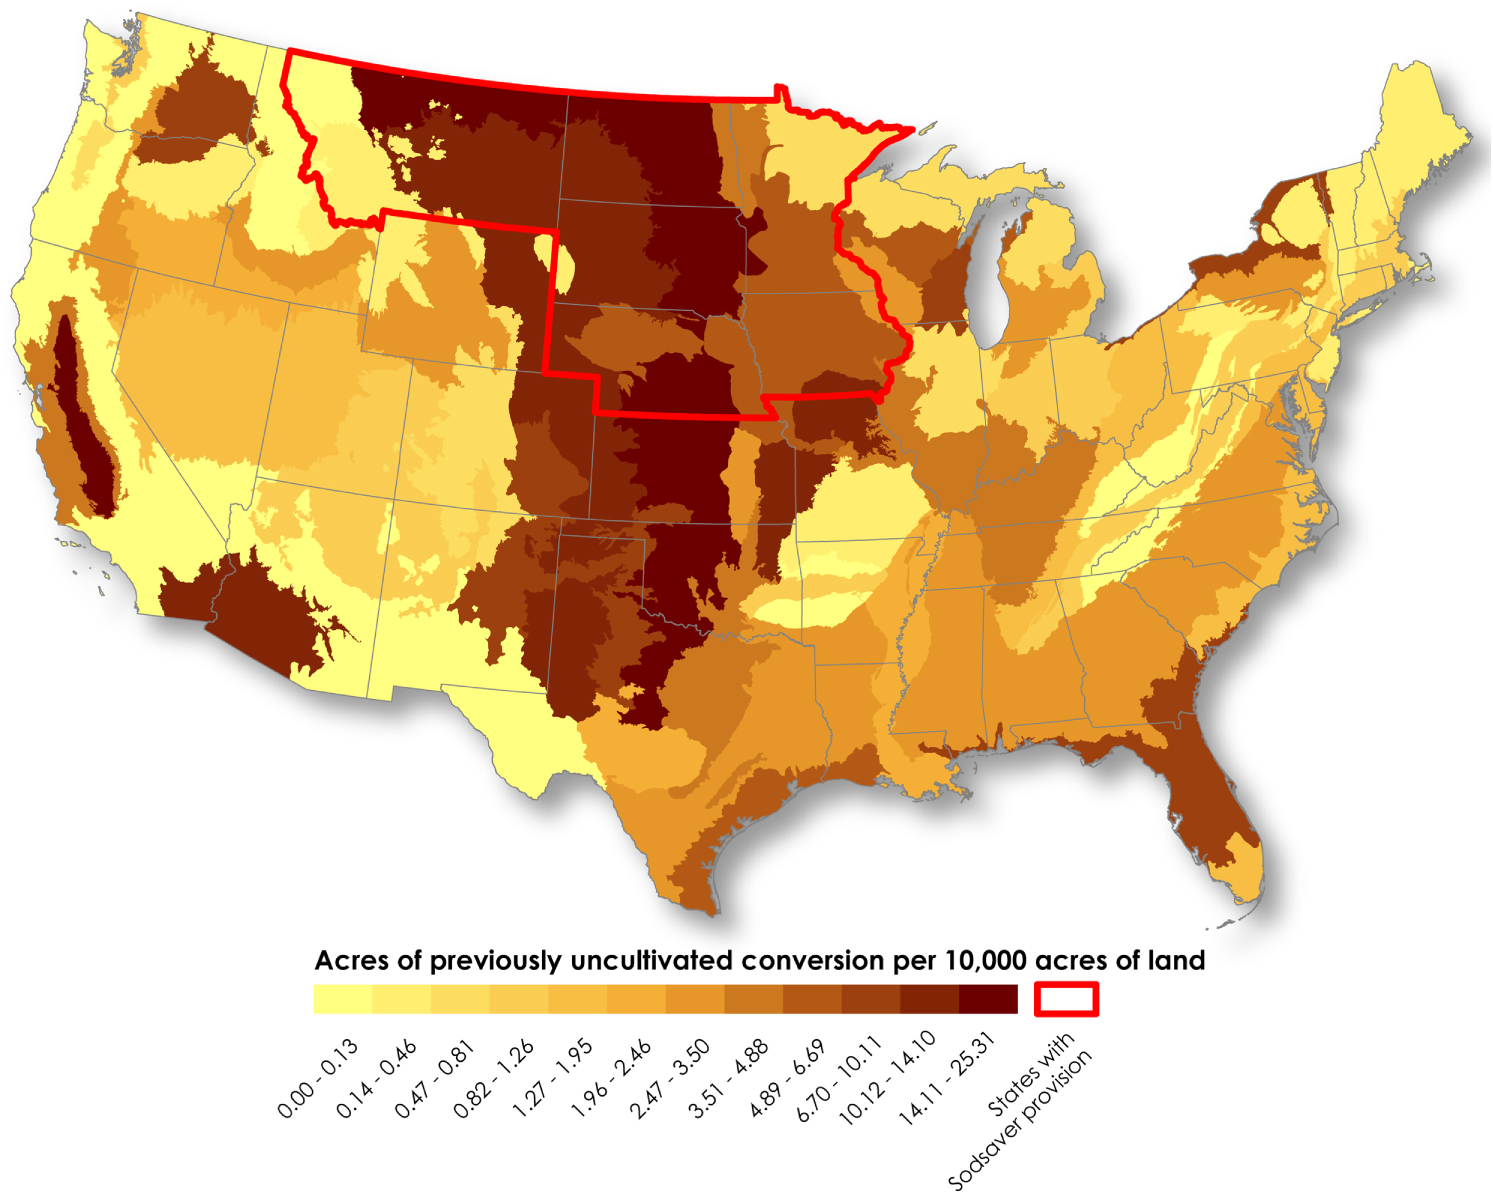
These findings are further supported by our analysis of USGS's long-term land cover trends data. Within the sample blocks, 11.3% of the land recently converted to cropland had not been classified as agriculture (cropland or pasture) dating back to at least the early 1970s. Nationwide, this detailed sampling suggests a total of 1.04 million acres (14.1%) of recent conversion came from land sources that had not been cultivated for more than four decades (figure 4).

Figure 4. 2008–2012 conversion of previously uncultivated land. Figure identifies the amount of conversion to cropland from land that had not previously been used for agriculture (cropland or pasture), confirmed back to the early 1970s. Display units represent average number of previously uncultivated acres converted per 10 000 acres of total land within each EPA Level III Ecoregion. Red outline is of the six states covered under the 2014 US Farm Bill 'Sodsaver' provision, which aims to reduce conversion of previously uncultivated land. The observed patterns of elevated nationwide conversion suggest that the new policy's limited geographic coverage will likely be insufficient to prevent the majority of new breakings.
Download figure:
Standard image High-resolution image3.3. Types of cropland expanding
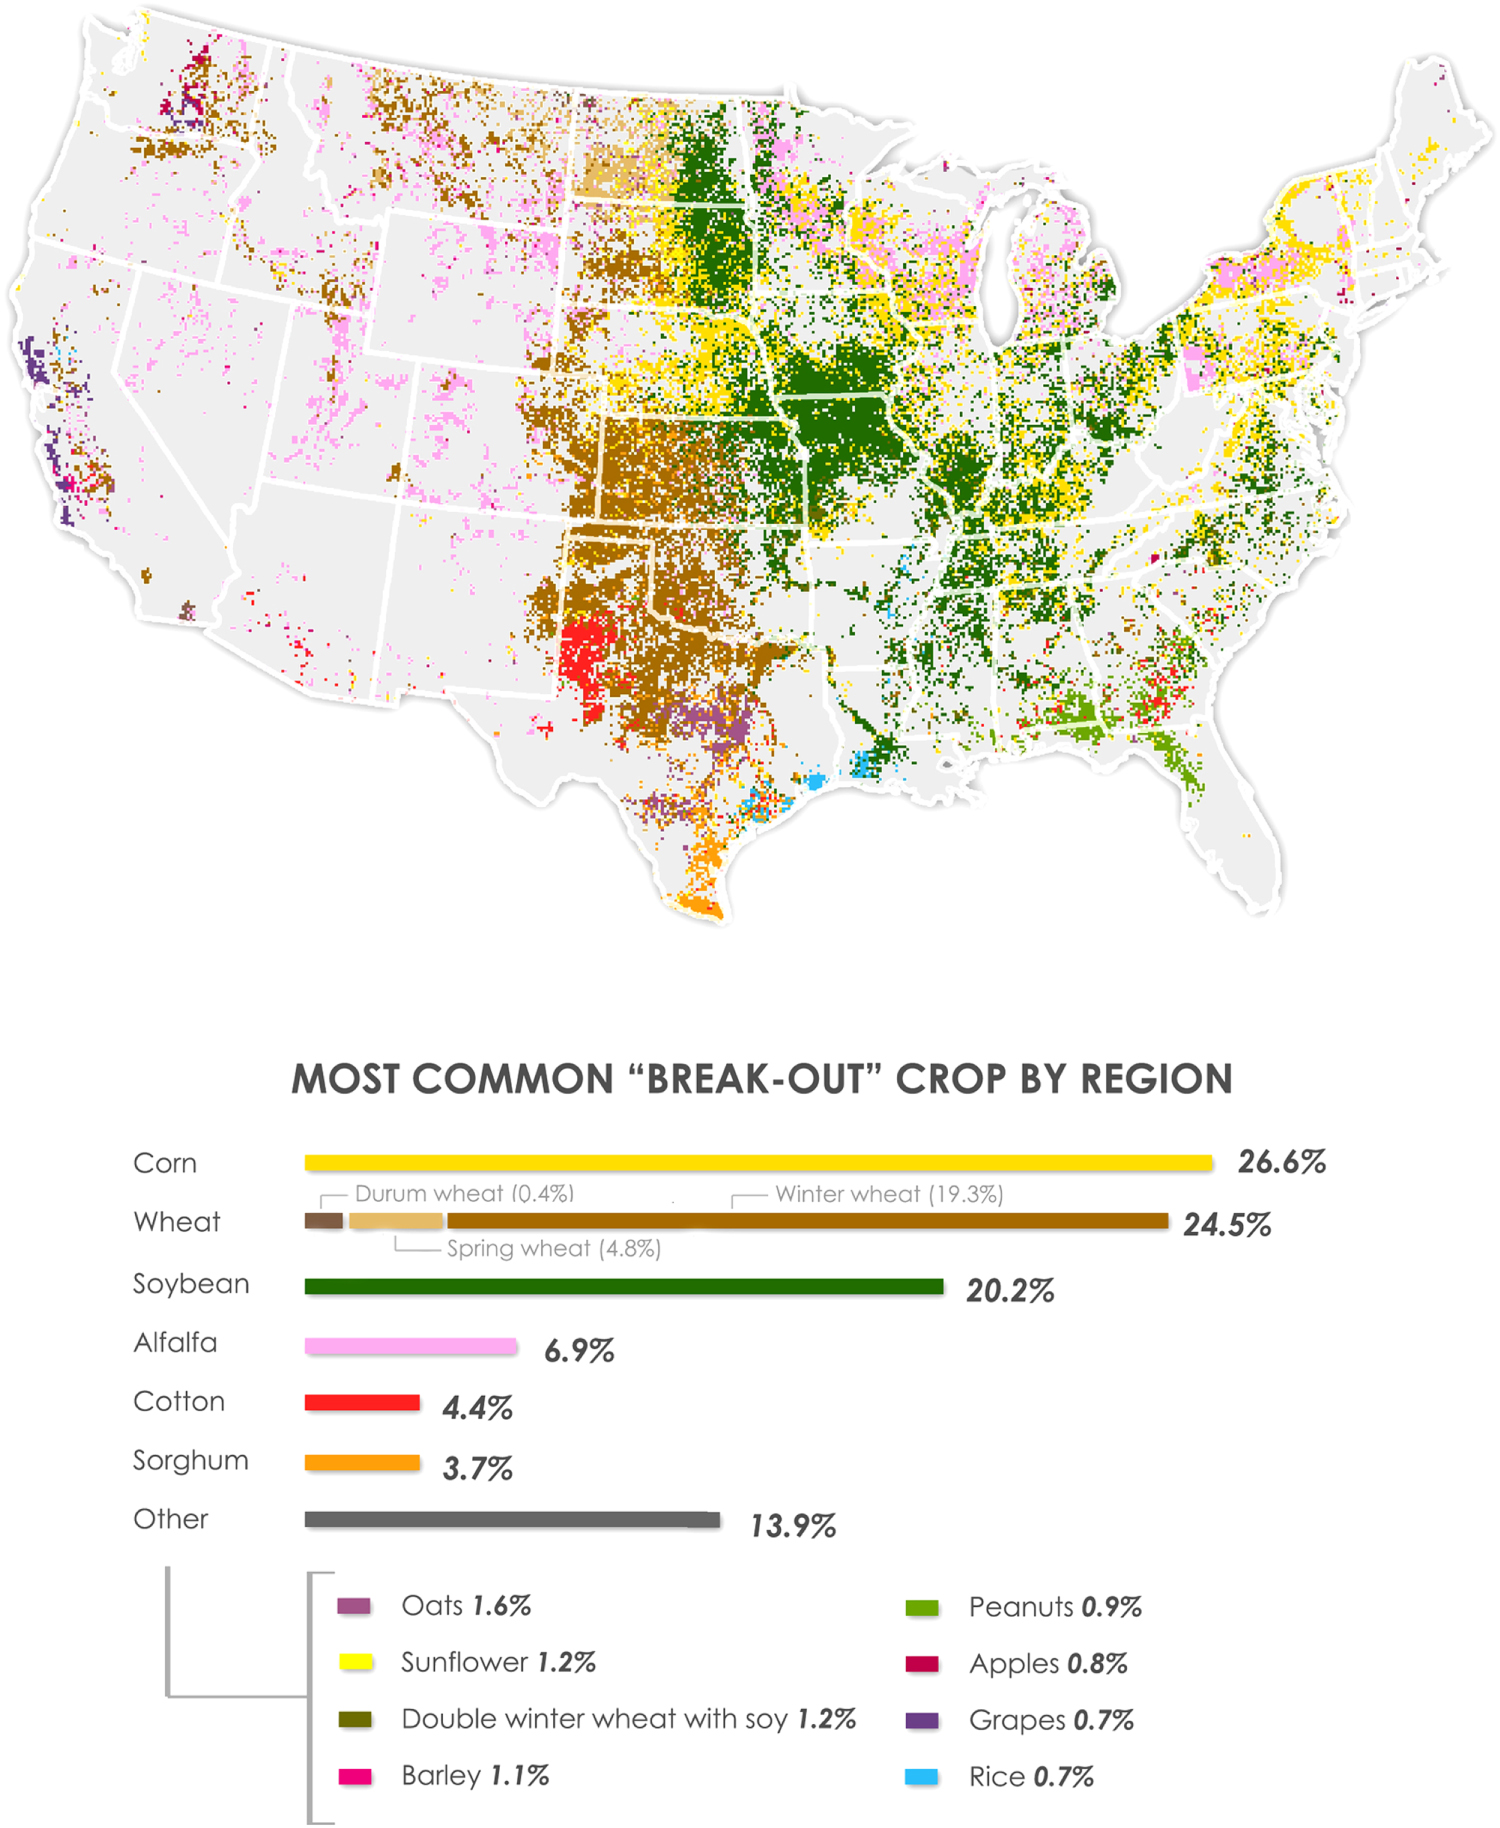
Corn was the predominant first crop planted upon conversion to cropland, grown on 1.94 million acres (26%) of newly converted land across the country. Winter, spring, and durum wheat collectively were the second most common breakout crop (25%), followed by soy (20%), and alfalfa (7%).
In 31 of the 47 states with conversion to cropland, corn was either the first or second most common crop to be planted immediately upon conversion. Corn and soy were most typical on new cultivation in the agricultural belt of the Midwest (figure 5). Wheat was the most frequent break-out crop in the Western Plains, despite a 15% decline in total planted area of wheat over the study period. While this likely reflects the crop's suitability in those climates, it can also signal displacement of wheat from existing croplands to newly converted areas, driven by increases in other crops on existing cropland.

Figure 5. Most common 'break-out' crop by region. Map represents the most common first crop to be planted after conversion to cropland 2008–2012. Corn and soy dominated much of the Midwest and periphery of the Appalachians, while wheat becomes more common moving westward across the plains, with spring wheat in the north and winter wheat in the south. Note that the map depicts only the predominant type of breakout crop grown in an area and does not necessarily reflect the amount of each breakout crop grown there. Nationwide prevalence of each breakout crop is indicated in the legend bar graphs.
Download figure:
Standard image High-resolution image3.4. Contribution of individual crops to total change
Allocating land conversion based on the relative contribution of each crop to total changes in crop area can provide insights to the total (direct and indirect) domestic land use impacts of specific crops. Between 2008 and 2012, 59 of 98 independently tracked crops increased in area for a combined total of 16.8 million acres. Corn experienced the largest growth in area, 8.6 million acres, representing 51% of all gains (supplementary table S6). Cotton, the second most increasing crop, expanded its footprint by 2.3 million acres. Assuming new conversion is proportional to a crop's change in area, corn would account for 51%, or 3.8 million acres, of the 7.34 million acres of new conversion to cropland. Similarly, cotton would be assigned 14% of new conversion, or 1 million acres.
In total, the 16.8 million acres of individual crop increases contributed to 7.34 million acres of new conversion, resulting in an overall conversion ratio of 43%. That is, for every additional acre dedicated to a specific crop over the study period, total cropland expanded on average by 0.43 acres. The remaining 0.57 acres were thus directly accommodated by decreases in other crops (i.e. replacement on existing cropland). Similarly, knowing at least 4.3 million acres of recent conversion came from sources other than land exiting the CRP indicates, on average, at least 25.3% of all individual crop increases were met by bringing new, non-CRP land into cultivation.
3.5. Quality of converted land
New expansion occurred most frequently on marginal land that had severe to very severe limitations to cultivation, whereas previous croplands were most concentrated on prime farmland characterized by fewer limitations (figure 6). As a result, total marginal cropland area expanded at twice the rate of cropland on well-suited soil (1.5% versus 0.77%, table 1). Crops planted on land deemed unsuitable for cultivation also experienced high relative growth (1.1%) over the study period. However, the amount of crops grown on the least suitable land (LCC 7-8) declined. This suggests that even as farmers expanded onto marginal and poorly suited lands to meet growing demand, there remained a continuous optimization by shifting away from the lowest quality areas.

Figure 6. Land use and recent conversions by land quality. Graph shows for each cropland category the percent of land identified as prime, marginal, or unsuitable for row crop cultivation based on increasing levels of limitations defined by the USDA Natural Resources Conservation Service. Expansion, abandonment, and intermittent use of croplands all occur most frequently on marginal land, whereas existing crop extent was most concentrated on prime farmland.
Download figure:
Standard image High-resolution image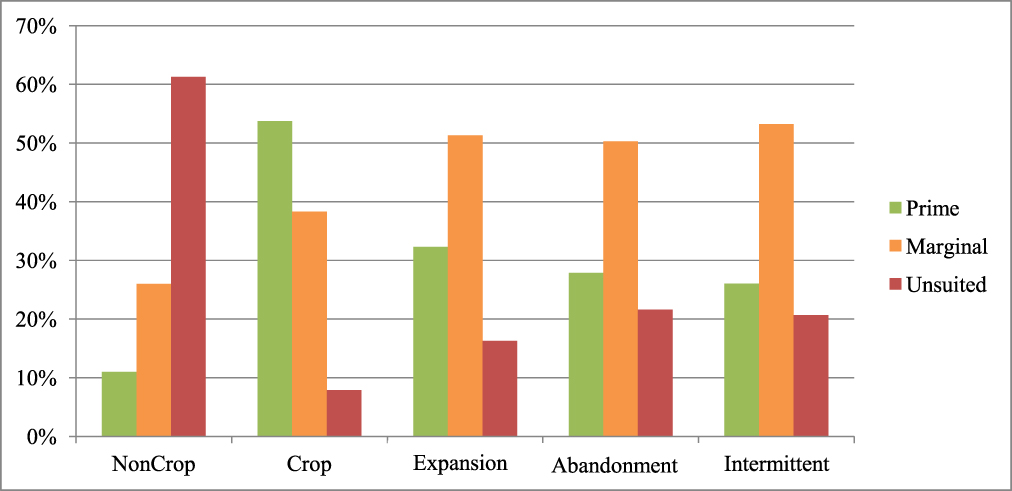
Table 1. Relative rates of land conversion by capability class. Rates were calculated by dividing the amount of change 2008–2012 by the amount of existing cropland in each capability class.
| LCC | Cropland expansion | Cropland abandonment | Net expansion | Net expansion (aggregated classes) | |
|---|---|---|---|---|---|
| 1 | 0.7% | 0.5% | 0.2% | 0.77% | Prime |
| 2 | 1.7% | 0.8% | 0.8% | ||
| 3 | 3.1% | 1.7% | 1.5% | 1.5% | Marginal |
| 4 | 4.4% | 3.0% | 1.4% | ||
| 5 | 3.8% | 3.0% | 0.8% | 1.1% | Unsuitable |
| 6 | 5.9% | 3.8% | 2.1% | ||
| 7 | 4.9% | 5.5% | −0.6% | ||
| 8 | 7.9% | 7.9% | −0.1% | ||
Overall, the high growth on marginal and unsuitable lands may signify evidence of increasing land scarcity in the US. Though highly suitable areas remain (figure 6, non-crop), the limited growth on these lands suggests that they are either not available for cropland use or are otherwise constrained. A more detailed investigation of the US's remaining potentially available cropland should be undertaken to fully understand the constraints and tradeoffs associated with cultivating these areas.
4. Discussion
The US experienced substantial shifts in agricultural production over the past decade, leading to considerable uncertainty surrounding the pathways and consequences of recent crop expansion. Our trajectory-based analysis of land conversion addresses the challenges in previously available data and adds substantial detail in both crop and spatial specificity (supplementary table S7). By integrating data across three sources spanning 40 years, we were able to identify long-term patterns of cultivation, incorporate insights regarding previous land use, and improve confidence of identified land conversion. As such, data produced here provide the most complete, corroborated evidence of national-level conversion suitable for action including carbon accounting, federal policy formation, and regulatory enforcement.
4.1. Uncertainty, limitations, and comparison to other results
We took multiple steps to reduce uncertainty in measuring land conversions. First, we improved accuracy of the original input data by combining all crop and non-crop covers into two consolidated classes, thus eliminating possible identification errors among spectrally-similar crops and non-crops. Integrating multiple data sources helped correct for individual anomalies in each source's classification, and assimilating many years of data provided improved signal discrimination compared to individual year assessments [42]. Additional actions were taken to address remaining known issues in the input data (see supplementary methods), and all spatiotemporal processing techniques were selected to aggressively remove areas of potential false change.
Spatial resolution limitations and temporal availability of data constrained our analysis such that results should generally be considered a conservative estimate of change. For example, our minimum mapping unit of 15 acres improved confidence in identifying conversion but also excluded incremental and smaller patches of change, such as those occurring when cultivation expands into field margins. In addition, the absence of future land use information precluded separating short-term idling of cropland from true long-term abandonment. Thus, some of the identified abandonment could reflect temporary conversion to non-crop use, resulting in a liberal estimate of abandonment and a conservative overall estimate of net expansion.
Our results are confirmed by other data, including FSA-tracked new breakings (supplementary table S8), published estimates of existing cultivated extent (supplementary table S9), and other estimates of recent cropland expansion (supplementary table S10). Our magnitude of net expansion (2.98 million acres) is supported by the NASS Survey-based estimate of 2.6 m acres [43]—the only other independent (but incomplete) estimate for the same time period—and is consistent with the higher level of expansion found in the most recent five-year census of agriculture [44]. We also found similar ratios of gross to net conversions as a recent statistical sampling of in-situ data from the National Resources Inventory (2013), suggesting that we accurately captured levels of on-the-ground change.
Previous studies found roughly half of new cropland came from CRP, and that only a portion of land leaving CRP was reverted to cropland, with the remainder used primarily for pasture [38, 45]. Similarly, our analysis of land sources showed that up to 42% of recent expansion may have come from land exiting the CRP, and that conversion to cropland could account for a maximum of 3 of the 5.1 million acre decrease in CRP enrollment during the study. Looking further at land sources, our four-year estimate of 1.04 million acres of converted previously-uncultivated land (dating to pre-1972) is consistent with the FSA's single year assessment that found nearly 400 000 acres of new cropland in 2012 came from land that had never before been reported as cropped [46]. Overall, our quantitative analyses are also consistent with farmer interviews and field survey data collected by others [47, 48]. For example, our finding that at least 25% of increased crop acreage was met through expansion onto land other than CRP reinforces the USDA's 2008 survey of corn and soybean farmers, who then stated approximately 30% of their additional cropped acreage came from bringing new, mostly non-CRP land into production [48].
4.2. Policy implications
Our results suggest a need to immediately review US agricultural and biofuel policies to ensure appropriate implementation and remove adverse incentives. Under the Renewable Fuels Standard (RFS2) of the Energy Independence and Security Act of 2007, feedstocks used for the production of renewable biofuels may be sourced only from land that was cleared or cultivated prior to December 2007. Thus, up to 1.9 million acres of new corn plantings and 1.5 million acres of new soy could be ineligible as renewable biomass. Due to aggregate monitoring under the EPA's current implementation of the standard, however, use of feedstocks from converted land has thus far been unrestricted. Our findings show substantial expansion of cropland post-2007, suggesting a need to reform enforcement strategies and trigger the biofuel recordkeeping and reporting requirements as mandated by the RFS.
In light of these findings, further research should be undertaken to understand the penetration and extent of ineligible feedstocks in the biofuel supply chain as well as the effects of recent conversion on ecosystems. Estimated carbon emissions from corn and soybeans planted on recently converted land could range from 94 to 186 MMT CO2e, and may be closest to 131 MMT CO2e. The emissions from these crops alone would be equivalent to a year's carbon dioxide release from 34 coal-fired power plants or an additional 28 million cars on the road. Given this non-trivial potential impact, a spatially-explicit assessment of the carbon flux from recent conversion is needed, as revelation of the direct land-use emissions likely warrants re-appraising the global warming potential of first generation biofuels.
Revision of Farm Bill policies could also help prevent further conversion of grasslands. Currently, federally-subsidized crop insurance reduces the risk of bringing new, predominantly marginal land into production [15, 49]. In an effort to stem additional conversion, the recently enacted 2014 US Farm Bill included a 'Sodsaver' provision that could help deincentivize the breaking of new ground by greatly reducing crop insurance subsidies on areas that are converted from native sod after January 2014. However, the provision currently applies to only Iowa, Minnesota, Montana, Nebraska, North Dakota, and South Dakota, and these states accounted for just 36% of identified cropland expansion on previously uncultivated land (figure 4, supplementary table S11). In addition, Sodsaver does not prevent conversion of forests or other native ecosystems. Thus, while the provision may help curb the loss of regionally select grasslands, it leaves many areas vulnerable to conversion. A comprehensive, nationwide Sodsaver provision would provide more thorough coverage and protection.
5. Conclusions
The nationwide loss of grasslands found in our study confirms alarming trends previously reported at local and regional scales. Compared to croplands, grasslands harbor significantly greater plant, microbial, and animal diversity, and generate higher levels of nearly all agriculturally-vital ecosystem services including pest suppression and pollination [8]. Thus, recent cropland expansion may actually be undermining the very agricultural productivity it seeks to gain. Furthermore, because the converted land is typically less suitable, economic and environmental costs of the recently-expanded crop insurance program may be higher than expected [15, 49]. Given these risks, the identified trading of grasslands for grains raises substantial concern. However, closing the gaps in existing US agricultural and energy policies may provide an effective solution for protecting remaining grasslands while facilitating a more climate-smart approach to meeting the nation's bioenergy goals.
Acknowledgments
We thank NASS's Spatial Analysis Research Section for their helpful clarifications and insights about USDA statistics on crop acreage and the Cropland Data Layer. We also thank Richard Plevin, Christopher Wright, and George Allez for their helpful comments, as well as 2 anonymous reviewers who significantly improved the paper. We thank Masrudy Omri and Ian Schelly for mapping assistance. The Wisconsin Bioenergy Initiative and California Air Resources Board provided funding.