We had a call from someone who had become frustrated with trying to change the Primavera P6 Gantt chart gridlines for printout. If you didn’t know, the Gridlines toggle in the print page setup dialog only controls the gridlines of the activity table; and not the Gantt chart. The good news is that Primavera P6 does allow you to change the gridlines of the Gantt chart. Primavera P6 calls these ‘sight lines’, and you will have to look elsewhere to find these options; they are not located in the print options.
If you’ve ever had to scale down a large schedule to fit it on an 11×17 sheet of paper or smaller, then you may have wanted to adjust the gridlines on the Gantt chart. Too many gridlines may make your Gantt chart unreadable. But where do you find the gridlines options in Primavera? The gridlines toggle in the print page setup only sets the gridlines options for the activity table. And this feature is limited at best. In the Bar Chart Options Primavera has numerous gridline options for including suitable sight lines on the Gant chart for printout.
This article explores the many sight line features in Primavera P6 for making the Gantt chart easy to read.
As we have already established, the Gantt chart gridlines features are not located in the print page setup dialog. The gridlines or sight lines, as Primavera calls them, are associated with the Bars dialog, and may be activated several different ways. One way is to select the View | Bars from the main drop down menu. In the Bars dialog select Options, and then the Sight Lines tab. You also could get here by right clicking anywhere on the Gantt chart, and then selecting Bar Chart Options from the menu options that appear. And, again select the Sight Lines tab.
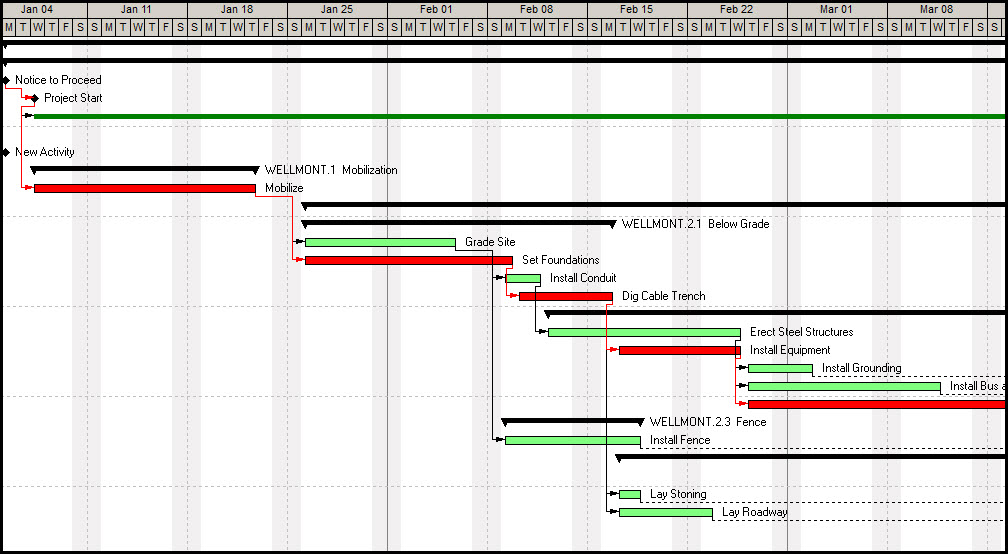
Figure 1 displays a schedule with no sight lines.
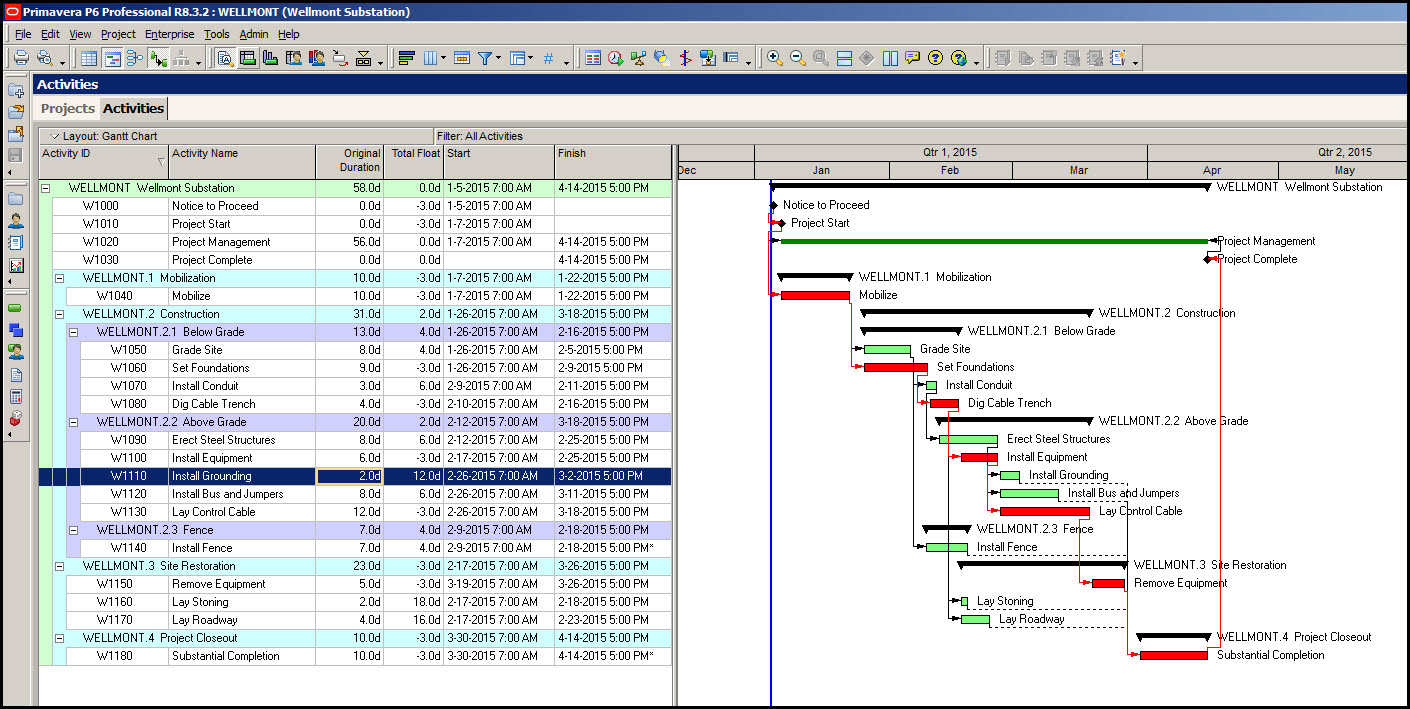 Figure 1
Note the timescale is currently set to Month/Quarter. Let’s change the timescale so we can better see the schedule on a weekly basis. Right click on the Gantt chart and select Timescale from the resulting dialog, Figure 2.
 Figure 2

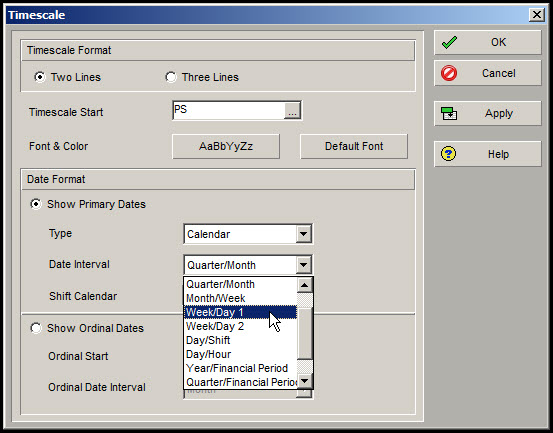
In the Timescale dialog change the Timescale to Week/Day1, Figure 3.
Figure 3
The Gantt chart should now look similar to Figure 4.
Figure 4

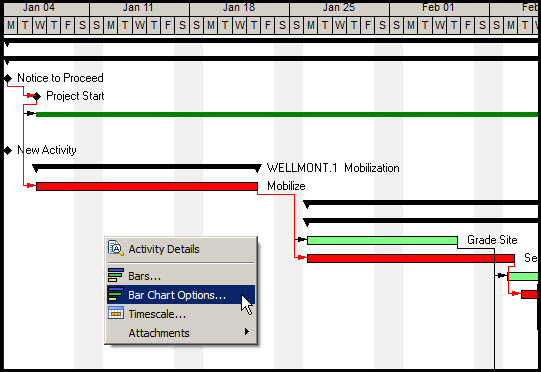
Now to add or adjust the sight lines, right click on the Gantt chart and select Bar Chart Options, Figure 5.
Figure 5
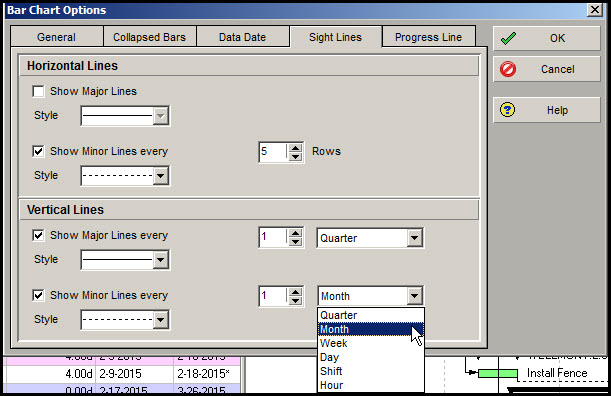
In the Bar Chart Options dialog select the Sight Lines tab, Figure 6.
Figure 6
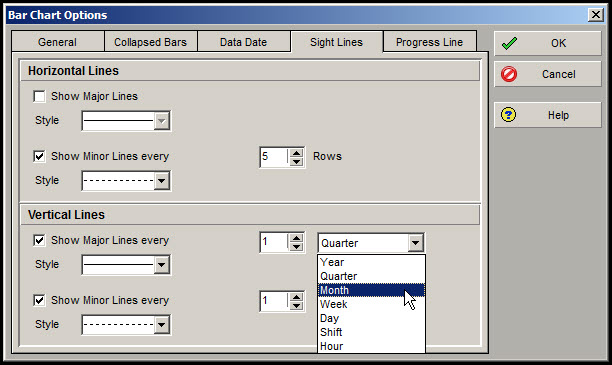
Set the Horizontal Lines to toggle off the major sight lines, but toggle on minor sight lines every 5 rows. As you can see in Figure 6, we have several options for displaying vertical sight lines. For our schedule we want to display major vertical lines every Month, Figure 6.
You can choose to skip a month by changing the corresponding vertical line setting from one to two. We, however, want to display the major vertical lines every month without skipping months. Set the minor vertical lines to display a minor grid line every week, Figure 7.
Figure 7

The resulting Gantt chart with corresponding sight lines will look similar to Figure 8.
Figure 8
As displayed in Figure 8, minor sight lines are displayed every week and major sight lines every month.
Now suppose we wanted to display the schedule using quarters, and the corresponding sight lines. First, let’s change the timescale by right clicking on the Gantt chart and selecting Timescale from the resulting dialog. Change the Date Format to Year/Quarter, Figure 9.
Figure 9

Now in the Bar Chart Options and Sight Lines tab set the major vertical lines to display every quarter and the minor vertical lines to display every month, Figure 10.
Figure 10
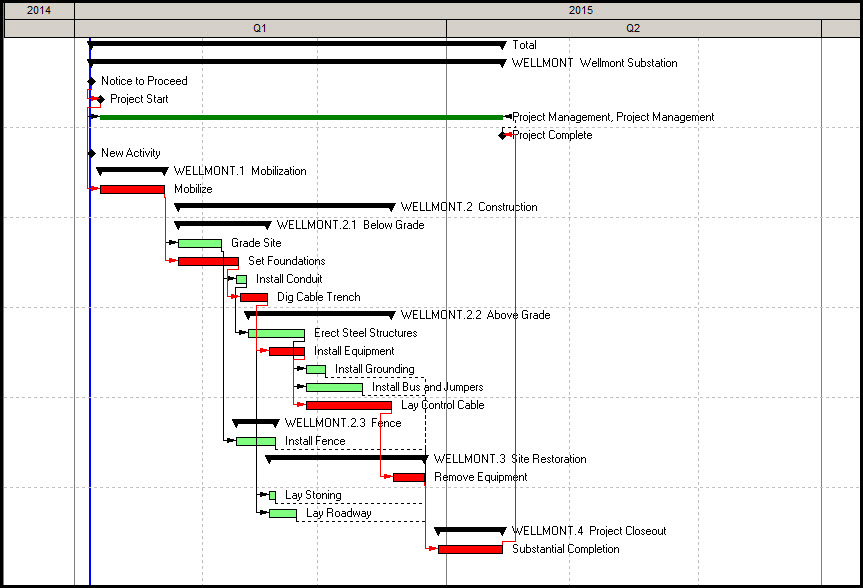
The resulting Gantt chart will look similar to Figure 11.
Figure 11
Summary
Once you know where to look for adjusting the Gantt chart gridlines or sight lines you will see that Primavera P6 has numerous options for displaying both horizontal and vertical sight lines. You can adjust the sight line increment and associated timespan as appropriate for your schedule print scale and paper size. Sight Lines are one of numerous features in Primavera P6 for displaying and printing the Gantt chart.