This blogpost supports a new report available to schools in FFT Aspire, but may be of interest to a wider audience. Download the report for your school now.
When the 2019 Key Stage 2 performance tables are published in a few weeks, we will bid farewell to the much unloved Key Stage 1 to Key Stage 2 value added measures in their current format. Next year, the cohort will have been assessed under the new arrangements at Key Stage 1 in 2016 and so the current prior attainment groups (based on the old system of levels) will no longer apply.
Value added measures could still be calculated using the new teacher assessments. I showed some options here.
But do we really need them? Could we do something else instead?
What’s the point?
Let’s go back to why we have value added measure in the first place.
There was a time when we didn’t have school performance tables or Ofsted, and little, if anything, was widely known about the performance of individual schools. The Conservative government of the early 1990s introduced these two planks of accountability, via the Citizen’s Charter, ostensibly as a means of providing the public with more information.
It quickly became apparent that the performance of schools varied. But so did prior attainment and so value added measures for primary schools were born in 2002. They were useful because they showed school-level attainment net of prior attainment. Around 60% of the variation in Key Stage 2 attainment could be explained by Key Stage 1 prior attainment.
At a system level, policymakers are (or should be) interested in understanding how and why attainment varies. This also includes the extent to which schools play a part. On the whole, it’s not as much as many assume (around 10% of the variation in pupil attainment is attributable to schools at Key Stage 2) but there are some schools where performance seems unusual, in some cases consistently so from year to year.
Value added was one way of identifying schools with unusual performance. Unfortunately, over time the measures came to increasingly be uses for high-stakes decisions. This bent the measures out of shape and junior schools bore the brunt more than most.
Contextualised attainment
Key Stage 2 attainment is systematically associated with prior attainment. But it is also systematically associated with other stuff such as age, gender, disadvantage and so on (albeit more weakly). In education we’ve tended to lump this other stuff under the heading of “context”.
So we’ve calculated a contextualised attainment measure. This works a bit like value added in that it compares the attainment of a school with what you might expect given the context of the pupils. But whereas value added does this purely on the basis of prior attainment, contextualised attainment does so on the basis of pupil-level demographic characteristics[1] and some school-level characteristics[2] but not prior attainment.
The correlation of all of these things with KS2 reading scores was 0.53 in 2018, and with maths 0.54 . This compares to correlations between KS1 average point scores and KS2 reading scores of 0.69, and between KS1 APS and KS2 maths scores of 0.74. That prior attainment is a stronger predictor of Key Stage 2 attainment than these other pupil and school characteristics.
That said, the contextualised measure is fairer on some dimensions.
Firstly, there is a one-point difference in value added scores on average between junior schools and primary schools. This isn’t apparent with contextualised KS2 attainment, as the table below shows. In fact, junior schools are fractionally higher attaining on average.
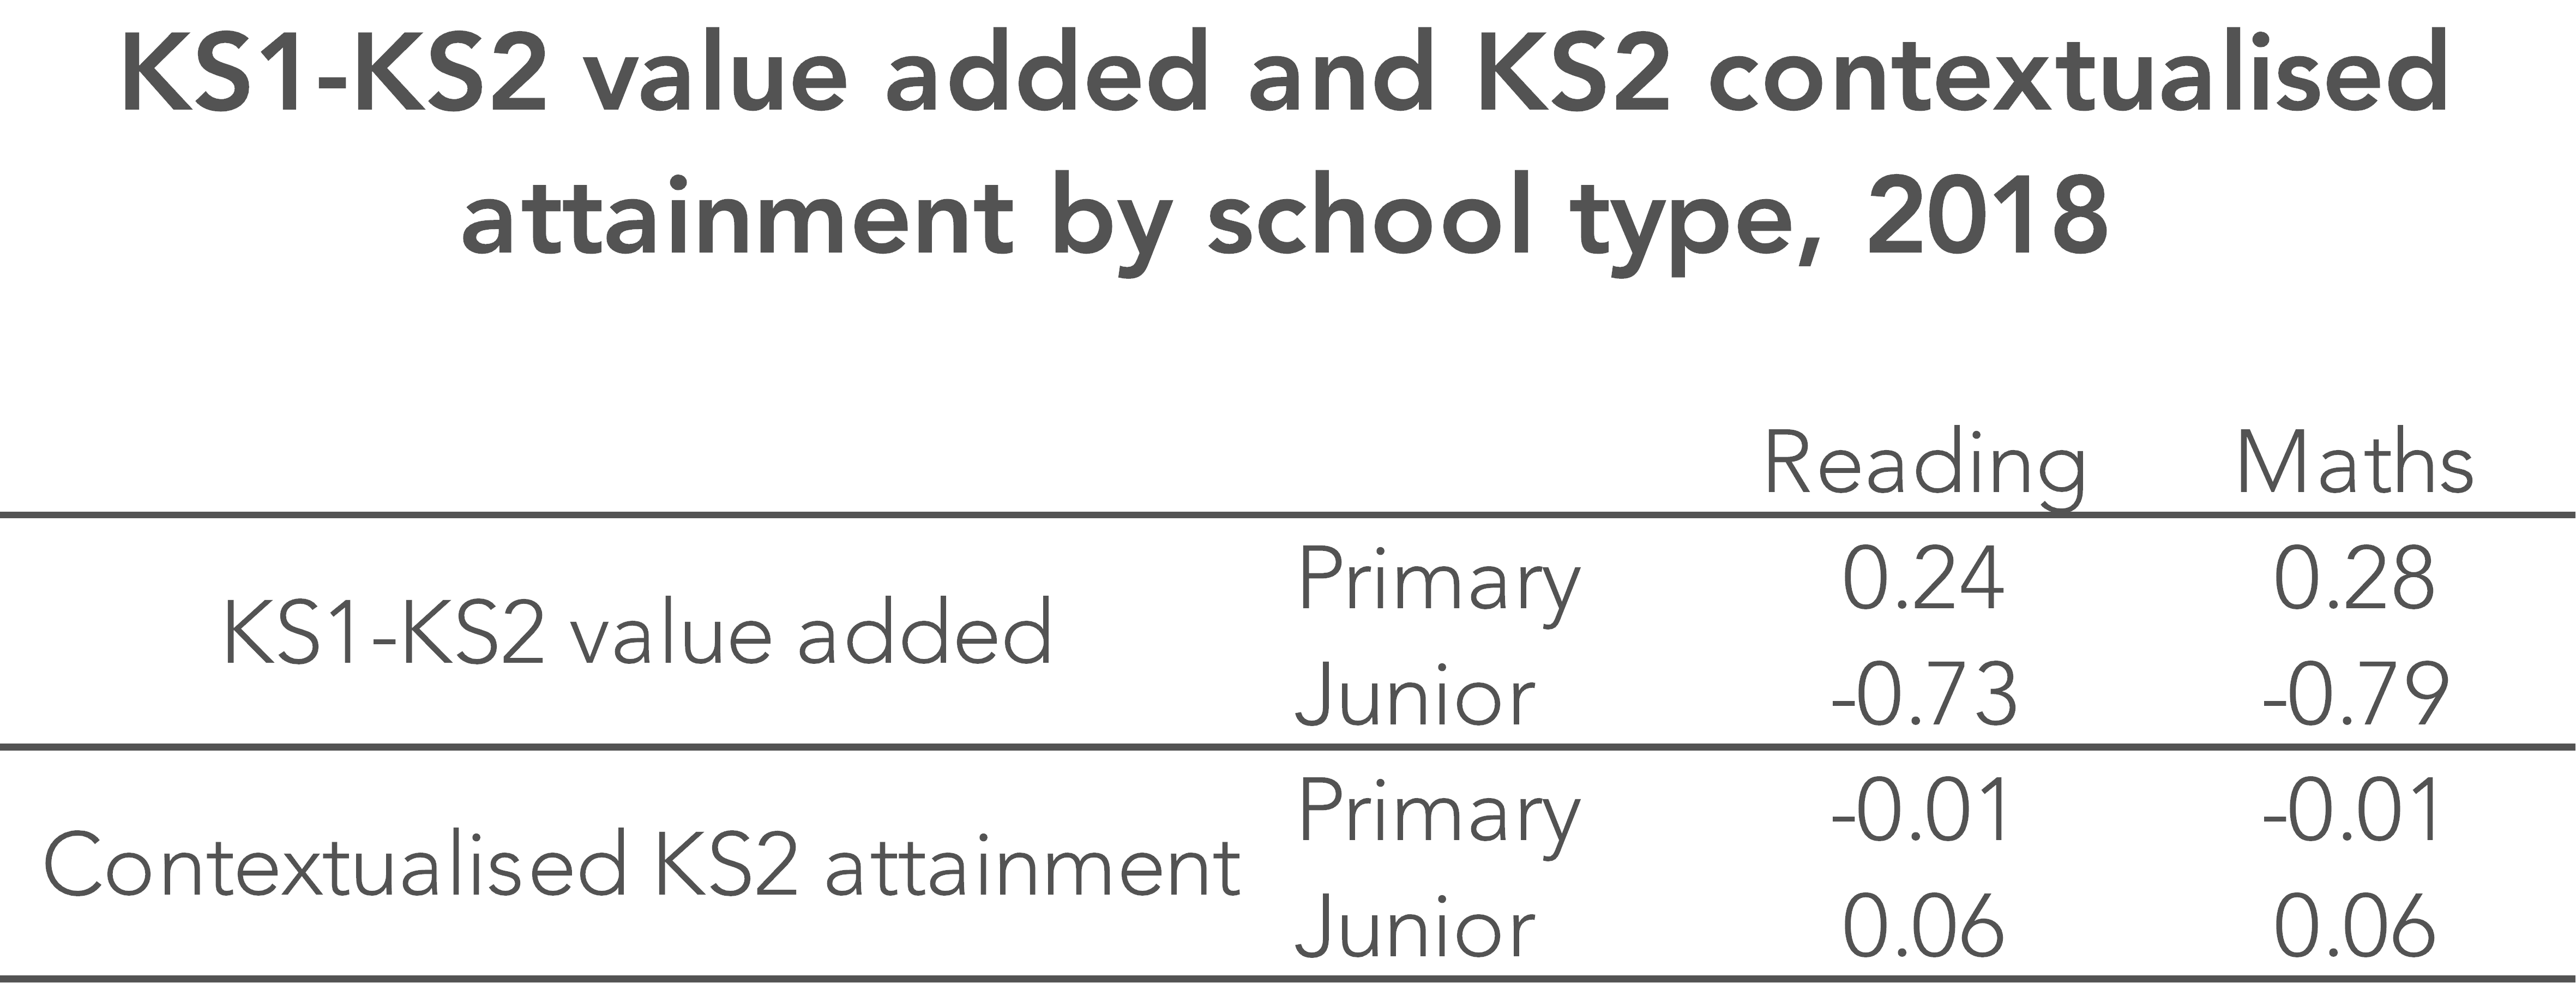
Secondly, at present the least disadvantaged schools tend to achieve higher value added scores. This is tuned out by design in the contextualised KS2 attainment measure – see the chart below. This is because in effect, we are comparing schools with similar levels of disadvantage to each other.

Looking at the relationship between KS1-KS2 valued added scores and contextualised KS2 attainment, they are correlated reasonably strongly – see the table below – but there are large differences for some schools.
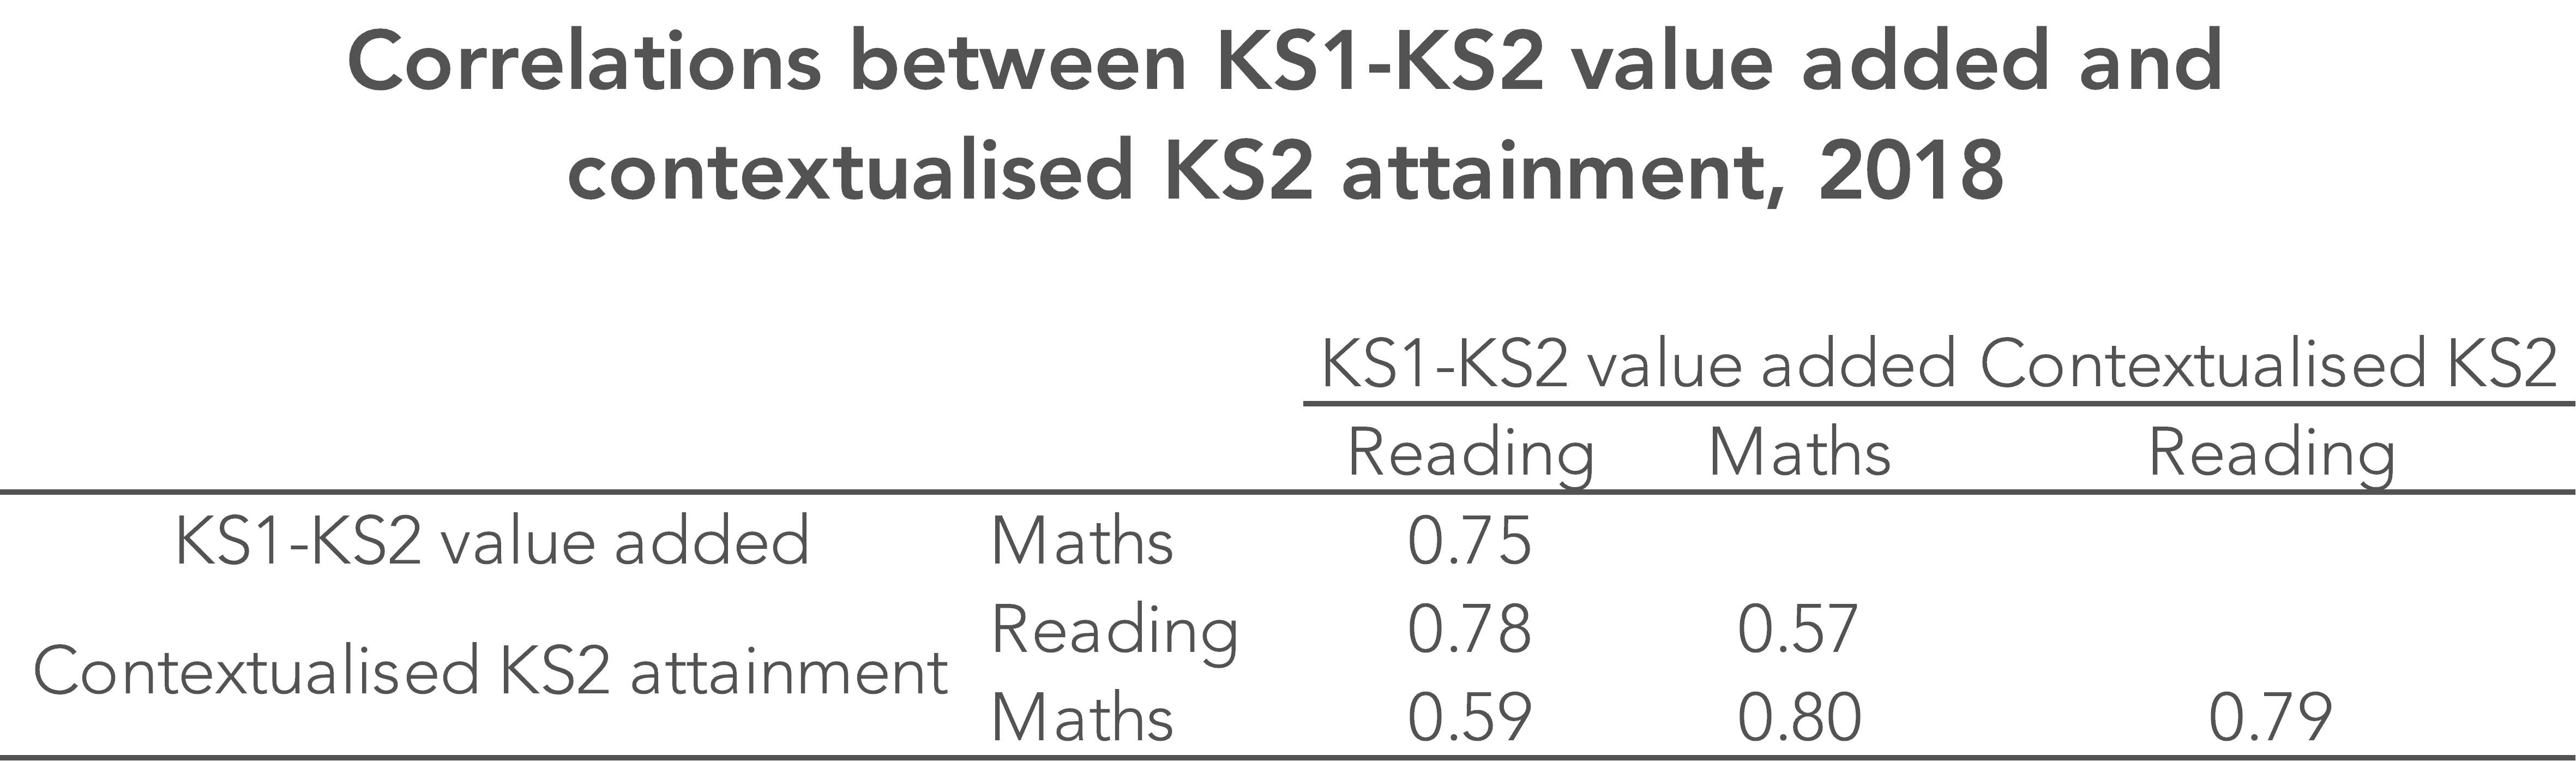
In reading, there are some schools which move from the bottom 10% on one measure to the top 10% on the other.
In other words, there would be winners and losers from introducing contextualised attainment measures. Not everyone can have positive scores.
In addition, the choice of which factors to take into account can make a big difference. Some might argue that special educational needs identification is largely up to a school to determine so shouldn’t be included. Others might say that school-level factors should not be included because teacher quality might actually tend to be higher in less disadvantaged schools.
These are important considerations in the design of a contextualised attainment measure. If you change the factors, you change the scores. And getting the sector to agree on which factors to include will not be easy.
But that would be OK if the purpose of the measures is to monitor and try to reduce differences in attainment between schools rather than to measure their effectiveness.
We’ve produced a free report for FFT Aspire users showing how your school’s contextualised KS2 attainment scores would differ from your KS2 contextualised value added scores – take a look now.
Want to stay up-to-date with the latest research from FFT Education Datalab? Sign up to Datalab’s mailing list to get notifications about new blogposts, or to receive the team’s half-termly newsletter.
1. The pupil level factors we include are month of birth, gender, first language, ethnic background, pupil mobility, percentage of school career identified as SEN, attendance during Key Stage 1 and disadvantage (percentage of school career in receipt of free school meals), IDACI score of neighbourhood and year of first registration at a state-funded school in England
2. The school level factors we include are percentage of disadvantaged pupils and percentage of pupils with a first language other than English


Leave A Comment