What’s in YOUR Profile?
What’s in YOUR Profile?
In part 1 of the blog series “What do we do about Cybersecurity?”, I identified the best way to get started with improvement is to perform a cybersecurity risk assessment of your organization using the NIST Cybersecurity Framework (CSF), along with several key problems with implementing it. In part 2, I provided some considerations for identifying your critical assets, data categorization, and threat identification.
In this part, I am asking “What’s in YOUR Profile?”

Please answer in the comments to this post, because I really would like to know! Given that my Google, Bing, Yahoo, DuckDuckGo searches for a sample of, or recommended data elements for, a NIST Cybersecurity Framework Profile have all returned nothing other than a reference to paid content, so I'll be the creator of a profile template that we are integrating into our Enterprise Cybersecurity Risk Management solution, Rofori.
The next step in the CSF process is to create a “current” profile that:
“… represents the outcomes based on business needs that an organization has selected from the Framework Categories and Subcategories.”
The CSF guidance for profile content is:
“This Framework document does not prescribe Profile templates, allowing for flexibility in implementation.”
Flexibility is great, but some suggestions or a sample or two would be nice. With no samples, or suggested content other than that described in the CSF core document, we need to figure out how to represent a CSF profile. The framework suggests the following for developing a profile:
“To develop a Profile, an organization can review all of the Categories and Subcategories and, based on business drivers and a risk assessment, determine which are most important; they can add Categories and Subcategories as needed to address the organization’s risks. The Current Profile can then be used to support prioritization and measurement of progress toward the Target Profile, while factoring in other business needs including cost-effectiveness and innovation.”
“The Current Profile indicates the cybersecurity outcomes that are currently being achieved.”
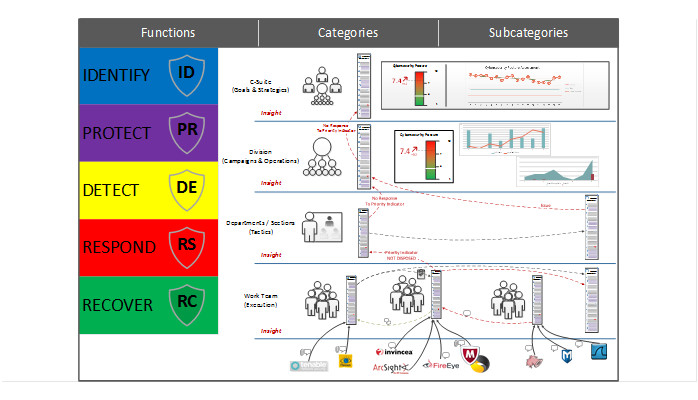
My objective is to ultimately compute a Cybersecurity Posture value based upon the actual results of an organization operating its CSF Profile. Since we will be performing risk based analysis, we need to identify and prioritize the CSF Subcategories currently being performed and then provide an outcome effectiveness value. By doing this, we can compute an overall effectiveness value and produce a heat map (risk profile map) for cybersecurity outcomes in a manner analogous to threats in a threat matrix.

As a starting place for my current CSF Profile, I am taking the CSF Core spreadsheet (…review all of the Categories and Subcategories …) and adding 2 columns:
- Subcategory Priority (…determine which are most important …)
- Outcome Effectiveness (“The Current Profile indicates the cybersecurity outcomes that are currently being achieved”)
A subcategory that has a priority value (I like using 1 to 10, with 10 being the highest priority) is a subcategory that is included in the profile. I then enter an effectiveness score that I derive from a self-assessment or a recent cybersecurity audit and enter the score (again, 1 to 10) for each subcategory that is in the current profile:

As you can see in my sample Current CSF Profile above, we are currently performing 8 of the 98 CSF subcategories with varying degrees of outcome effectiveness. I have computed the overall score, which is not robust enough to be a posture assessment, by calculating a scaled weighted average: For each subcategory, multiply the Priority and Outcome Effectiveness values, add them up for each of the 8 subcategories, divide by the number of subcategories, and scale the results to be between 1 and 10. This results in an overall score of 4.94 over 8 subcategories.
But, the score of 4.94 needs to be put into perspective of the number of subcategories employed. We next compute the normalized score by scaling the result by the percentage of subcategories in the profile (i.e., 4.94 x 8 / 98 = 0.40). This enables a more direct raw score comparison, but I believe that it is critical to know the number of subcategories along with the score. Thus I propose reporting scores in the form of “score|subcategories” (0.40 | 8).
The best approach is to be honest, it is better to identify a weakness than to ignore it. By identifying the accurate outcome effectiveness, you can make better informed risk-based business decisions. Notice subcategory PR.PT-3. We all know that we should operate our computers as a “user”, but it sure is convenient to log into an Administrator account ;)
Risk Assessment
In part 2 of this blog series, in addition to identifying and prioritizing your threats and weaknesses, I gave a preview of risk assessment results.
Step 4, Risk assessment – analyze your operational environment to discern likelihood and impact of cybersecurity events. Take your prioritized list of threats and weaknesses and for each one, add a score value (1 to 10) of the Probability of the event taking place, and then a score for the Impact of the event. You can create a heat map (risk profile map) that plots the events and identifies the threats and weaknesses where you need to take proactive action to prevent or mitigate threats.

In next part of this blog series, I’ll go through the creation of the Target CSF profile, identifying gaps, and implementing an action plan.
As always, your feedback and comments are welcomed.
One who cares about information security.
5yhow do you calculate Effectiveness Score? and how about Priority score? when you implemented a subcategory what does it mean to set priority score for that ? I can not understand difference between your priority and effectiveness.