 White Paper Summary:
Tools for report generation in industrial applications have been few and far between. Those that exist typically focus on functionality to deliver “Compliance” level reports, those reports that are absolutely necessary and core to the business at hand, and are typically vendor specific offerings. As such, functionality has trumped ease of use and efficiency. Often, business tools have been applied to address industrial reporting requirements, bringing their own set of limitations.
This white paper explores the functionality required for automated report generation in the industrial or automation marketplace. It highlights the key features that are now available in order to elegantly address all compliance reporting requirements (FDA, EPA, GAMP, etc.), but also open up the opportunity to use automated reporting for a wide range of performance reports. Performance reports enable users to easily deliver information pervasively, to drive increased understanding and foster continuous improvement.
It’s no longer just about the reports you need, at any cost. It’s about delivering all the reports you want, at a minimal cost.
White Paper Contents:
Business Level Products for Industrial Reporting Should be a Thing of the Past
These days, it isn’t a lack of data that is the problem, it’s the visibility into that data that’s challenging. But don’t get caught up into thinking that the solution is advanced analytics. There is a step that is far more valuable and easy to accomplish first.
We are surrounded by gigabytes and terabytes of data, being dutifully archived by our HMI/SCADA systems, Historians and SQL Databases. There’s a lot of comfort in knowing that the data exists, should you want to jump in and analyze it. And, no doubt, that is a valuable capability to have. But if that’s your modus operandi, then you’ll be diving into that sea of data without a suitable context with which to view it. The ability to recognize the unusual in data requires a level of familiarity with the data and the systems generating that data. Operators develop that familiarity through their day to day interaction with the process. Operators have been known to step into a control room and know through the hum and buzz that the process is running as it should. The development of that familiarity comes with time. The second level metrics are a bit harder to become accustomed to. By second level metrics, I refer to the calculations that are easily measured and reported on, based on primary sensor data. For example, an operator will recognize a pump running and while an HMI/SCADA may calculate and display secondary metrics like run-time, off-time, cycles per day, peak torque, motor temp, etc., it will be up to the operator to proactively review these results to become familiar with them enough to recognize a subtle shift or anomalous behavior. We are all well aware of retirement statistics and the workload on operators. Understated, an operator’s ability to be proactive is being diminished.
A solution to this problem comes in the new form of an automation specific report generator. This is not referring to the report generators of old, but a new class of report generator that makes the selection and presentation of data so easy to do, that you can have any report that you want, with minimal effort. “Easy” report generation is changing the game.
It’s likely that you’ve already had lots of experience with report generation. Your experience comes from vendor specific solutions, designed to meet the requirements of compliance reporting (FDA, EPA, State and Federal, Batch Quality, Validation, etc.) Compliance reports are the ones you “must have” to accomplish the business you are in. As a part of your fundamental business, they will be done at any cost. Hence, the tools don’t have to be great, they just have to get the job done. That’s been the level of the bar for industrial report generation. And due to this bar level, typical report generation goals have been set to the absolute minimum requirements.
Your experience may also include the use of BI (Business Intelligence) solutions such as SAP’s Crystal Reports and Microsoft’s SSRS (SQL Server Reporting Services), both still widely used in industrial automation applications. These approaches typically come with several compromises: 1) connectivity to data sources are limited to those with business interfaces (OLE-DB or ODBC), 2) these solutions are not aware of automation style metrics (OEE, Setpoint Analysis, Energy Analytics, etc.), 3) ease of use is secondary to functionality – domain experts are typically required for implementation, and 4) a significantly higher level of IT familiarity is required for solution rollout. These tools are very capable and are excellent for enterprise level reporting, but BI solutions all have limitations when applied to the world of industrial automation.
So, what are the attributes of an “Industrial” reporting solution?
Ease of Use
“Ease of use” is a CTQ (Critical to Quality) feature to meet the requirements of industrial reporting. In the world of automation, ease of use also means following the paradigm of the common “tools of the trade.” The tools of the trade in automation are configurable, and should not be “programmer” oriented. The eye is on the result, not the process. An engineer wants an HMI display, quickly and easily, reliable archiving of data, safe operation of a PLC, or the simple definition of a report. High level environments delivering this functionality are configurable through menus and selections, in a way that any plant personnel can easily learn and apply. For many years, the focus was on the integration of programming environments like Microsoft’s Visual Studio or VBA, to augment a configurable solution, enabling the “Yes” answer to “Can your system do that?” We are now in the age of “Give me the Fish,” not “Teach me to Fish.” Again, report generators of the past have never delivered on this “Ease of Use” CTQ, and as such, the opportunity for report generation as a corporate solution for information visibility and continuous improvement has been limited. This paradigm has shifted. Industrial strength, purpose built report generation is now easy and powerful, and therefore report generation is ready to become a significant component of every automation environment.
 Connectivity
A report solution for industry must have an understanding of “industrial” data sources. Users benefit most when a report can aggregate and analyze data from a variety of data sources, both business and industrial. From a product perspective, this refers to “Drivers” that can be installed to connect the reporting engine to any source of data that may exist in or outside of your plant. Data in your enterprise systems, wherever they may be, can be queried through business standards such as OLE-DB, ODBC or importing CSV or Excel files. While BI tools can address some of these sources, the wide range of industrial sources are not addressed.
Industrial data sources include industry standards such as OPC DA, OPC AE, OPC HDA, MODBUS, BACNET, and proprietary interfaces to HMI, SCADA, Historian, analyzer, custody transfer, batch and a myriad of vendor specific solutions. Often these data sources offer the ability to analyze and return data through advanced interfaces and performance is maximized when leveraging this functionality. For example, if the need is hourly averages for a day, it’s best to ask the source for that statistic rather than request a day of data (potentially tens of thousands of samples), to produce the hourly stats. Of course, if that level of analysis is required, and isn’t available from the source, an industrial reporting solution would package and compress remote requests of data and securely pass that data to the reporting server, performing the task as efficiently as possible. It’s also extremely valuable to recognize the different types of data in industry, for example Real-time, History and Alarm data, especially Alarm Data. An industrial report generator will have an understanding of alarms and provide the ability to intelligently query and display results based on the uniqueness of that data. Ideally, connectivity to disparate data sources will be normalized – presented in a similar fashion to the user – to remove any of the data access complexities and allow the user to remain focused on the task at hand, the simple access to their data.
Industrial Statistics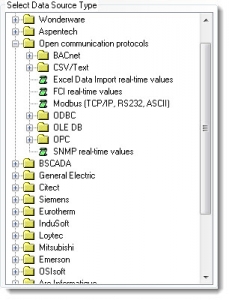
The world of automation wants answers to industrial questions. How many times did that pump cycle? What was the maximum and average temperature reached when the motor was running for over 1 hour? How long did that batch take? Does that furnace meet the required Thermal Uniformity Standards (TUS)? Is the building efficiency as expected for today’s weather conditions?
These answers can come from any reporting system, but will come “Easily” in a system designed with “automation” analysis at its core. Ideally, these metrics will be applied to a data query, and the results will be formatted for presentation with little additional effort, because the report generator is “Smart”, and display objects are aware of upstream statistics.
Many processes are time based. Examples are monthly, weekly or shift, reporting on production, energy or product quality. However, many processes are event based, displaying irregular start and end times. The latter can be considered analytics on “Batches” of data. Examples of the latter might be the recycle process of a water filtration system, triggered by a filter pressure and finished at a minimal turbidity level, or any traditional batch process as you might find in food, pharmaceutical or chemical processes. This type of reporting can be tricky for BI tools. Batches of data require the identification of the Batch, and then the subsequent queries of sensor data based on that batch start and end time, from automation data sources like plant historians. Batches may not be stored ahead of time. Batches may require manual identifications, or can be automatically triggered through the monitoring of a status variable (pressure drop or turbidity) as in our previous example. An industrial report generator can automatically name batches based on HMI/SCADA tag data or manual selections.
Formatting and Presentation
The formatting of data for the delivery of automation information is critical. All report generators offer formatting options for the display of values. But in the world of automation, values need to be displayed in a context, for example in relation to alarm limits, or the display of objects that conform to specific standards.
Take for example the Setpoint Analysis Report on a thermal process and the validation that the thermal processing was a success. The sample report (below) displays a variety of productivity features that are delivered through a set of standard analytic functions and graphic objects that are function aware. The analysis of a set of sensors, the detection of appropriate soak start and end times based on last sensor in and first sensor out, the calculations of duration and rate of changes, the final determination of Pass/Fail and the result presentation in a “Setpoint Analysis” aware trend chart are all examples of befits delivered in an application aware, automation oriented and user friendly solution.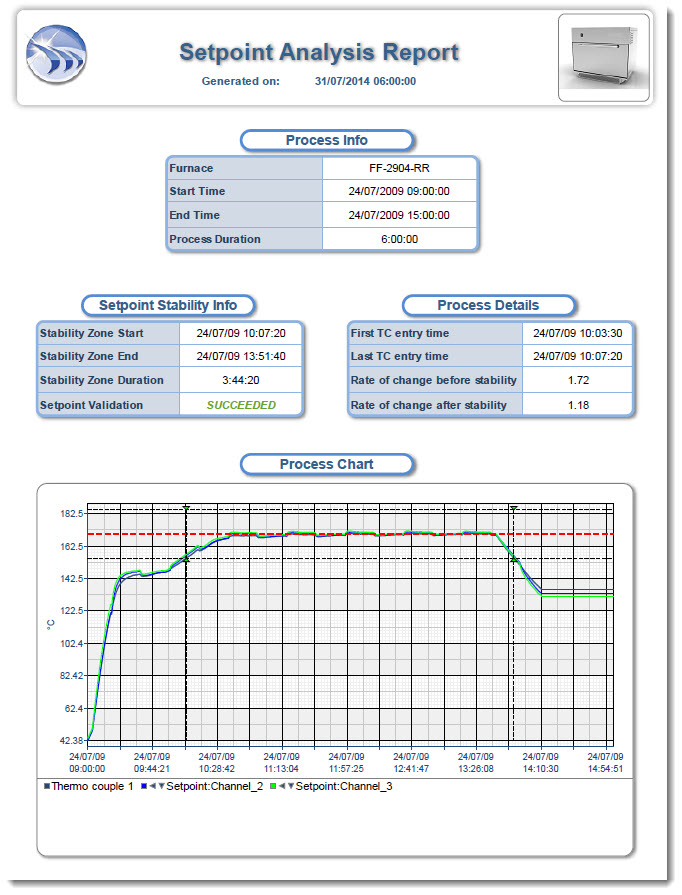
Of course, a reporting product should also offer a broad range of presentation objects such as Pie Charts, Bar Charts, Tables, Trends, X/Y Plots. In automation, users will benefit from numeric displays, gages with color bands, graphic images with data overlays and performance objects.
Manual Data Entry
Automation data is never complete. There is always the need for some level of manual data entry, either as lab samples or operator observations. A reporting solution for automation will deliver the ability to integrate user friendly data collection mechanisms. These can take many forms, from the automatic importation of CSV or Excel data files, to data entry forms in a web portal. In either case, the resulting reports will be a combination of both automatically acquired data from automation and business systems in combination with information entered manually, or through bar code and other data input methods.
Flexible Delivery Options
One of the most important aspects of any report generation solution isn’t the actual generation of the report. It is the storage and delivery of information. Here too, BI tools can come up short. The generation of information spawns the need to intelligently archive said information. This can include automatically naming directories, defining the longevity of storage, and automatically purging that which is no longer needed. After archiving comes delivery. Delivery often includes automatically emailing to individuals or groups. Reports are often delivered to remote archives and FTP should be an option. Finally, report access should be easily accessible through an Intranet or Internet web portal. Web portals should be supportive of all browser types, IE – Chrome – Firefox – Safari and both full browser and mobile browser form factors independent of operating system such as IOS, Android, Windows or Linux. These delivery options will all be a part of a robust reporting solution designed for ease of use and for automation system integration.
Support for Vertical Markets
In addition to the features for broad market appeal, report generation needs to address the requirements of vertical markets. The Life Sciences markets of Pharmaceutical and Bio-Tech require a high degree of security and user authentication, version management, audit trails, and electronic signatures. These features are necessary to address FDA 21 CFR Part 11 requirements.
Other markets may require High Availability and the ability for report generators to support primary and backup printing devices. In even more critical circumstances, reporting solutions may be required to work in tandem, allowing one report server to automatically take over in the case of a primary report server failure.
Conclusion
While business level tools can clearly address some of the requirements in the industrial automation marketplace, it is clear that new purpose built solutions offer significant advantages across the board, and especially in vertical markets. While automation oriented reporting tools may initially be higher in their purchase price, their overall cost of ownership will be greatly reduced due to the savings in development and customization, the delivery of canned automation statistics, an easy to use configuration environment, and a greatly reduced learning curve. With connectivity to all automation data sources, purpose built automation report generation solutions can aggregate information from a wider range of sources than traditional BI tools. Finally, as a configured solution with all functionality already integrated, these tools will display higher reliability and significantly reduced long term maintenance.