By the end of 2009, the United States had installed 1,164 cumulative megawatts of solar PV. In less than five years' time, that total had skyrocketed to nearly 15,000 megawatts, according to GTM Research and the Solar Energy Industries Association's U.S. Solar Market Insight report.
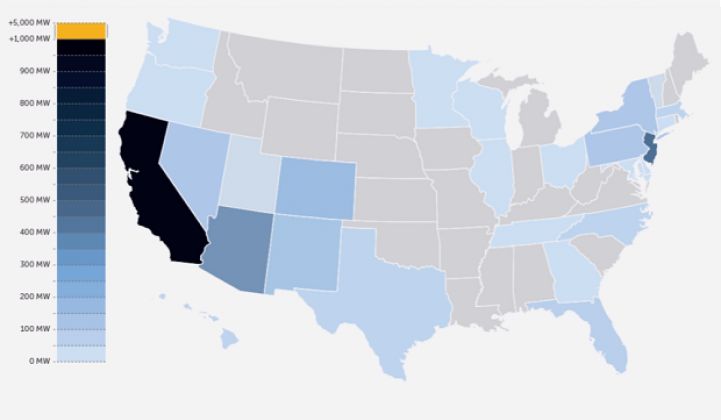
The short animation below shows the adoption of solar PV across the nation's top 30 solar states. In the first quarter of 2011, California crossed the 1,000 cumulative megawatt mark, and in Q4 2013, the state installed 1,200 megawatts of PV in just three months.
Other states to keep your eye on in the animation are Arizona, New Jersey, Massachusetts and North Carolina.
(For optimal viewing, watch in full screen at 720p here)
GTM Research and SEIA will be releasing the Q3 2014 U.S. Solar Market Insight report at next month's U.S. Solar Market Insight conference in San Diego.
***
For an overview of the U.S. PV market and state rankings, download the free executive summary of the U.S. Solar Market Insight report. In order to gain access to all of the granular data, the report is also available for purchase.
Note: As of Q2 2014, the other twenty states have installed a combined 170 megawatts of PV.


 41
41
 15
15
 9
9