This Map will Show You the Best (and Worst) Cities to Make a Living
What is the most important measure for your family when it comes to financial security? Is it the poverty rate in your community? The overall unemployment rate? Or is it the total take-home pay coming into your pocket each year? We suspect it’s the latter, so we created a new map showing the places with the 10 highest and 10 lowest median annual earnings in the country.
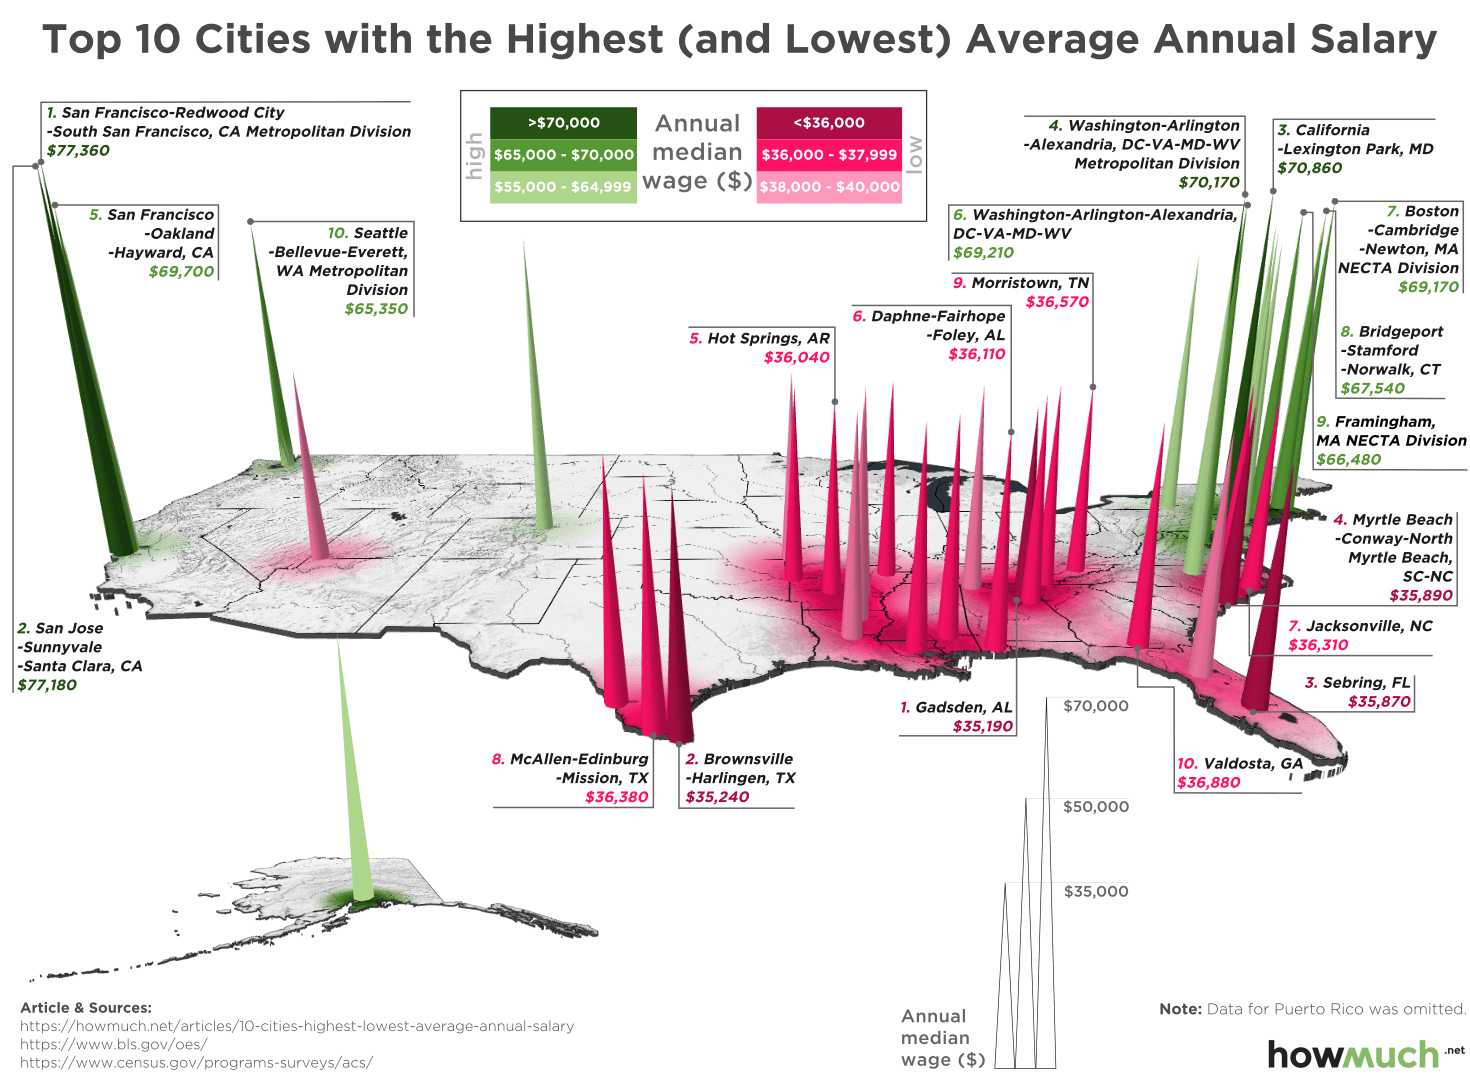 We analyzed occupational employment statistics from the Bureau of Labor Statistics for 381 metro areas. Figures represent the median annual income as of May 2017, the most recent information available. We took the 10 cities with the highest incomes and the 10 with the lowest and mapped them as green and red spikes, respectively. We then labeled the top 10 in each category.
Top 10 Cities with the Highest Annual Median Wages
1. San Francisco-Redwood City-South San Francisco, CA: $77,360
2. San Jose-Sunnyvale-Santa Clara, CA: $77,180
3. California-Lexington Park, MD: $70,860
4. Washington-Arlington-Alexandria, DC-VA-MD-WV: $70,170
5. San Francisco-Oakland-Hayward, CA: $69,700
6. Washington-Arlington-Alexandria, DC-VA-MD-WV: $69,210
7. Boston-Cambridge-Newton, MA: $69,170
8. Bridgeport-Stamford-Norwalk, CT: $67,540
9. Framingham, MA NECTA Division: $66,480
10. Seattle-Bellevue-Everett, WA: $65,350
Top 10 Cities With The Lowest Annual Median Wages
1. Gadsden, AL: $35,190
2. Brownsville-Harlingen, TX: $35,240
3. Sebring, FL: $35,870
4. Myrtle Beach-Conway-North Myrtle Beach, SC-NC: $35,890
5. Hot Springs, AR: $36,040
6. Daphne-Fairhope-Foley, AL: $36,110
7. Jacksonville, NC: $36,310
8. McAllen-Edinburg-Mission, TX: $36,380
9. Morristown, TN: $36,570
10. Valdosta, GA: $36,880
The most obvious trend from our map is that cities with the lowest paying jobs tend to be in the Southeast, whereas most of the cities with the highest paying jobs are either on the West Coast or in the Northeast. You might expect places like San Francisco and San Jose to top the list, given the presence of so many high paying jobs with the tech community. The same can be said for Seattle and Boston. Interestingly, Washington, DC makes the top 10 as well, perhaps suggesting that there’s money to be had if you’ve got connections to those in power.
But we think the best place to live is probably San Francisco. It has an unemployment rate of just 2.8% (the lowest of any in the top 10) and a poverty rate of just 9.2% (the second lowest in the top 10). That signals an economy running at top speed. Great weather, by the ocean, plenty of good paying jobs—now if only they can do something about the earthquakes.
Seattle, Boston, San Francisco—you’ve no doubt heard of many of the cities with the highest paying jobs. Gadsen, Brownsville, Sebring—do any of those places ring a bell? Many of the metro areas with the lowest paying jobs are hard to find on a map precisely because they aren’t known for any booming industries. As a matter of fact, Texas has two cities in the bottom 10, neither of which are the big ones you’ve already heard of like Dallas or Houston.
There are a couple of interesting surprises on our map at both ends of the spectrum, however. Fairbanks, Alaska makes it into the top 10 (with a median salary of $56,760), thanks in large part to the scarcity of labor on the last frontier and the oil industry. Alaska produces so much oil that instead of taxing people’s income, the state government actually pays people to live and work there. Boulder, CO also stands out as the only city on Mountain Time making it into the top 25.
Inequality is one of the defining themes of the U.S. today, but it can be a hard thing to illustrate. Our map shows where the haves and the have-nots tend to live and, although it is not a complete picture, it demonstrates enormous regional differences in take-home pay for American workers.