
Recent strength in the US stock market has given a lift to a whole bunch of stocks. Here we run our stock scanner and technical analysis charts over a few of our members most watched stocks.
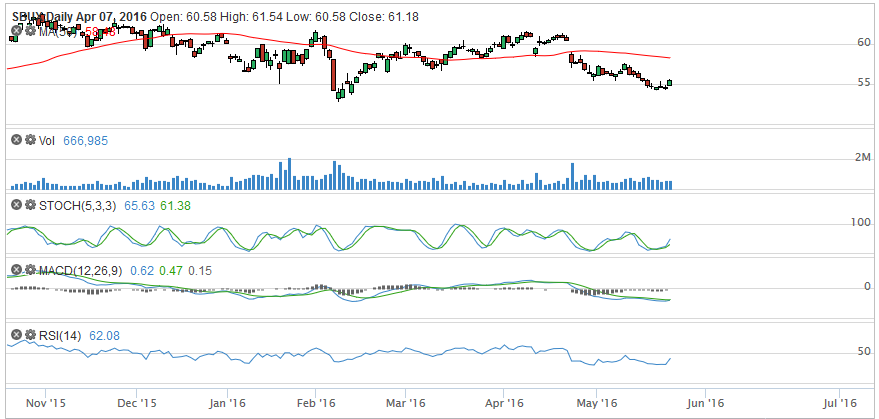
Starbucks (SBUX) stock price has been on the move from a two month low of just above $54. Firstly, running our scan for MACD cross up, we see that the MACD is crossing up for the first time in over 30 days. This tells us price is moving in a positive way.
The stochastic on SBUX also crossed up whilst it was consolidating at the recent lows, and with this move RSI has come from 30 (often classed as oversold) to climb above 40. A sustained move in price should get RSI up and above 50 which is considered to be strong.
Short term, the 50 period moving average is above, just near the gap down from April 22nd. Any rise from here could be heading towards that area, so an increase to $58 – $59 is a possibility. Risk is a break below the low of $54.
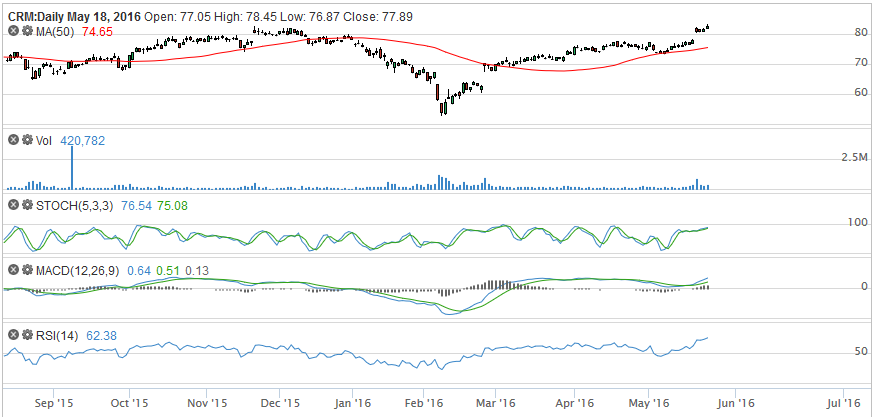
Salesforce (CRM) stock price gapped up above $80 last week, and the technical analysis has remained strong. The MACD crossed up above the zero line, RSI has continued to climb high and now stands at 75.
The surge in volume on May 19th and subsequent strength suggests that the bears are not in control here. CRM stock price is above both the 100 moving average and the 50 moving average, with all technical indicators suggesting that there is strength on the way.
A break above $83 would mean a new 2 year high for Starbucks, and if it can hold above that high, there is no resistance to base analysis on. Target is anyone’s guess, but risk is a breakdown below $80.
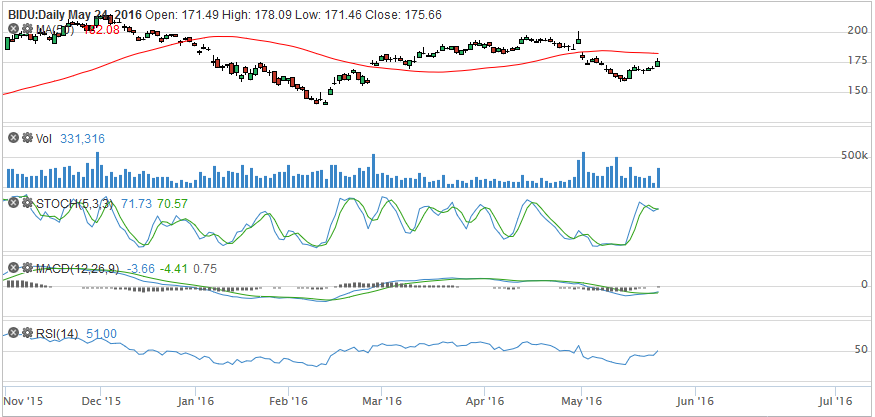
Baidu (BIDU) stock price has rallied from a 3 month low of $158.50 to close yesterday at $175.60. This has been a strong technical move coupled with an increase in volume over the last 30 days. Our MACD screener has detected that MACD crossed up yesterday, and RSI screener has detected that today it’s moved above 50.
Stochastic is high, but not overbought and price is heading towards the 50 moving average. If the strength continues, a retest of the recent resistance at $197 could be possible. Risk is breakdown below $165.
Start using our stock scanner to help you find the best possible entries for stocks on the US market.