Ghosts, zombies, witches… and unemployment rates. If you want a real scare this Halloween, check out these charts hand-picked by Quartz’s writers and editors that show the most ghastly trends in the global economy.
But be warned—these blood-curdling bars and bone-chilling lines aren’t for the squeamish…
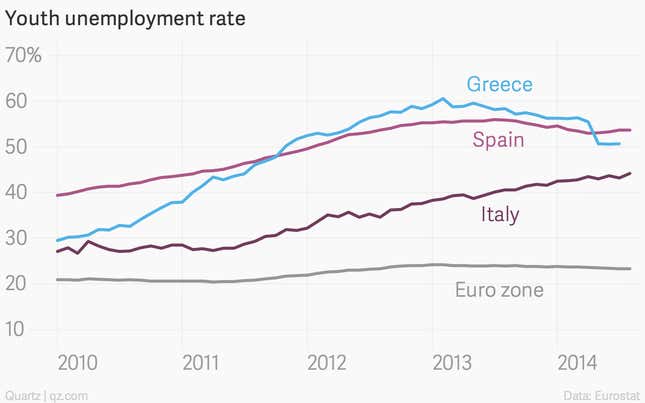
1. Southern Europe’s jobless youth
More than half of Greek and Spaniard young people are out of work, and have been for some time. But while youth unemployment rates there have plateaued (or even started to fall), Italy’s stagnating economy is pushing more and more young people out of work.
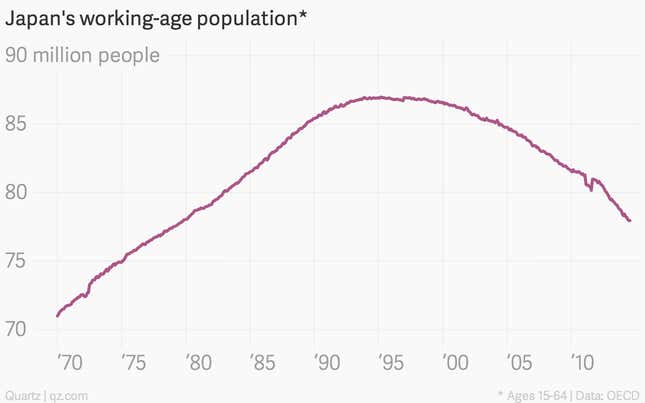
2. Japan’s rapidly shrinking workforce
Japan’s working-age population peaked in 1995, and it’s been downhill ever since. The world’s largest share of over-65s as a percentage of population, an incredibly low fertility rate, and a daunting debt burden are all conspiring to limit Japan’s economic potential. But the really scary thing is that this is a sneak preview of what much of the Western world faces in the not-too-distant future.
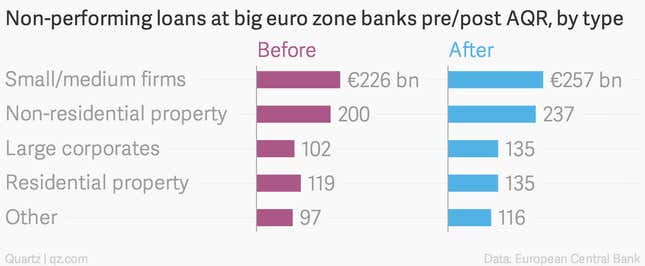
3. Europe’s sickly banks
Europe’s biggest banks mostly passed a recent stress test, but that doesn’t mean that they’re in particularly good health. The European Central Bank’s “Asset Quality Review” (AQR) uncovered some €136 billion ($172 billion) in non-performing loans—that’s billion with a “B”—that banks had misclassified. What other unreported horrors still lurk in their balance sheets?
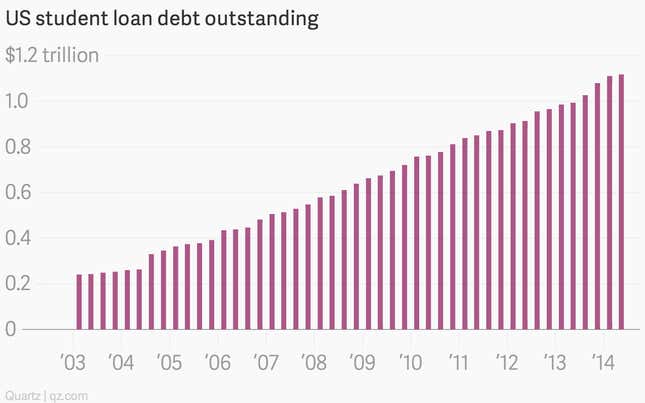
4. America’s escalating student debt…
The stock of outstanding student debt in the US has surged to more than $1.1 trillion. This isn’t all bad news—more people are in college, which is a good thing. But some economists suggest that the burden of student debt is reshaping the spending patterns of younger Americans, prompting them to put off buying houses, cars, and much else besides.
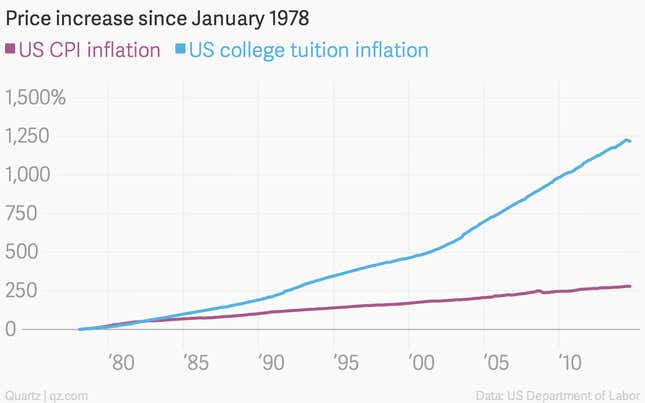
5. …And its outlandish university tuition costs
Everyone knows that higher education is a costly undertaking in the US. But until they see this chart, it’s hard to understand exactly how expensive it is. Since 1978 college tuition costs have surged more than 1,200%, compared with an increase of 280% for overall prices, as measured by the consumer price index. For the record, US colleges counter that this measure only captures the “sticker cost,” and actually overstates the amount most students really pay because of grants and other financial breaks.
6. China’s teetering property market
China’s housing market is in a slump, and it might be too late for the government to do anything about it. The country relies heavily on property to prop up economic growth, and a slowdown of the world economy’s most important growth engine will be felt acutely, especially in commodity markets.

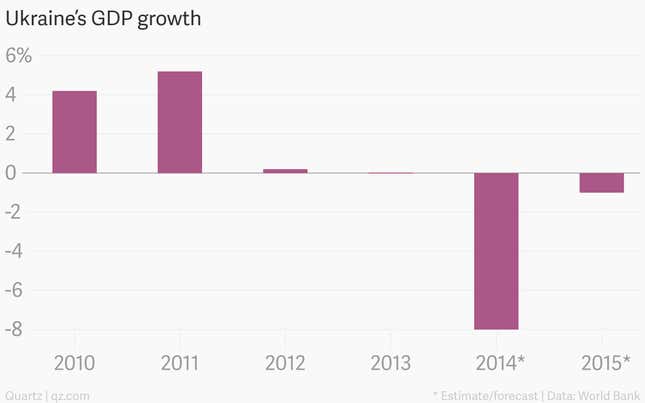
7. Ukraine’s shattered economy
Ukraine’s economy is on track to shrink by a whopping 8% this year, according to the World Bank. Analysts expect the country’s war-torn economy to decline even further next year, and it was hardly in good shape even before the recent unrest.
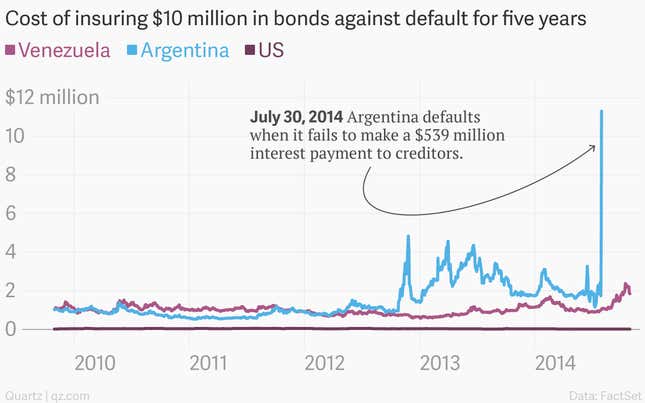
8. South America’s wobbly giants
The finances of Argentina and Venezuela, respectively the second- and third-largest economies in South America, are once again in shambles. Argentina notched its second default in 13 years in July, when it failed to make a $539 interest payment to creditors. (That was part of a long, complicated fight with creditors.) Meanwhile, doubts about credit-worthiness have increasingly hovered over Venezuela, where surging inflation and price controls are leading to shortages and rationing.
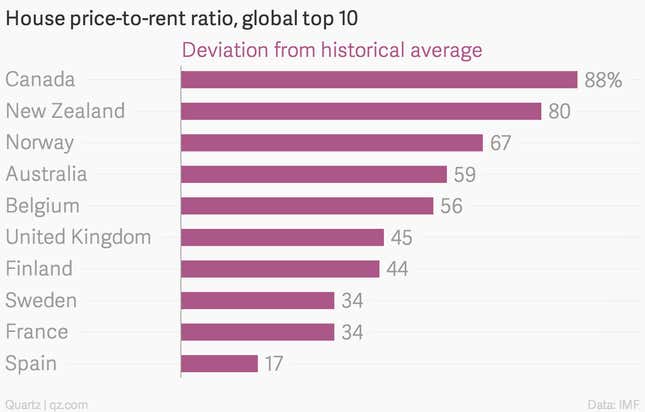
9. Canada’s exuberant housing market
You don’t have to look too far back in the financial history books to find episodes in which real estate bubbles ended badly. Japan. Sweden. Spain. Ireland. And, the mother of them all, the US. Some are worried that Canada could be careening down a similar path. Sure, there are differences. Canada’s banks seem to be on relatively solid footing. And the structure of the Canadian mortgage market—home loans are full-recourse there—might prevent a drastic surge in defaults. Still, keep an eye on this one.
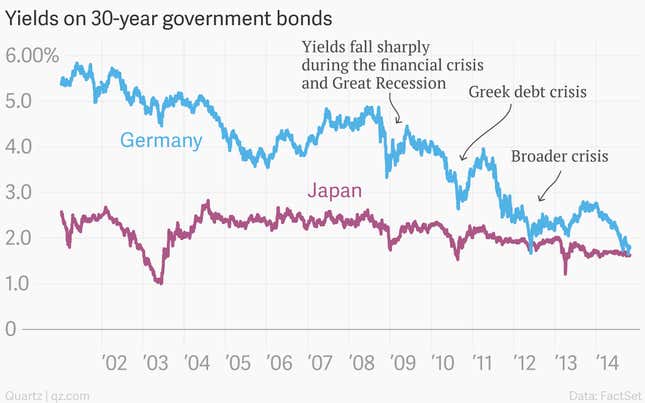
10. The Japanification of Europe
Europe looks to be well on its way toward following Japan into a spiral of low growth and possible deflation. Bond yields of the European safety benchmark—Germany—tell the tale. Yield first fell sharply in reaction to a series of crises that drove investors into super-safe government bonds. More recently, rising risks of deflation in Europe have driven German bond yields to converge with those of Japan, which has been trying to conclusively win a decades-long battle with falling prices.