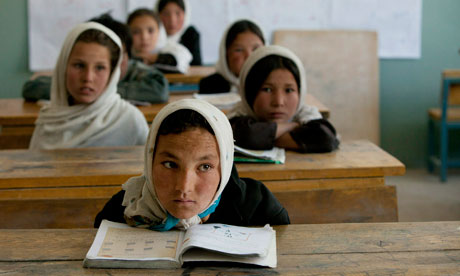
Afghan girls at Markaz high school in Bamiyan, where girls are able to attend school without any fears, unlike many in the Taliban-infested areas. Photograph: Paula Bronstein/Getty Images
More than 40% of the world's out-of-school children live in countries affected by conflict. That's just one of the findings in a new UN report on the state of education, out today.
Published by the United Nations Education, Scientific and Cultural Organisation (Unesco), the report pulls together the most recent data on schooling and education around the world, and – for the first time – also analyses the data through the lens of conflict.
"When wars break out, international attention and media reporting invariably focus on the most immediate images of human suffering. Yet behind these images is a hidden crisis. Across many of the world's poorest countries, armed conflict is destroying not just school infrastructure, but the hopes and ambitions of generations of children."
Focusing on the 35 countries labelled "conflict-affected" by researchers at Peace Research Institute Oslo (PRIO), the Unesco report provides a snapshot of the state of education amidst the world's conflicts.
It also provides data on the amount of money spent on education in countries affected by conflict, looking at both national public spending and at international aid flows.
According to the report's data, 21 developing countries spend more on arms than on primary schools. Meanwhile, only 2% of humanitarian aid goes towards education (with the vast majority of aid requests for education in conflict-affected states left unfulfilled).
The consequences are stark. In poor countries affected by conflict:
- 28 million children of primary school age are out of school (42% of the world's total)
- a child is twice as likely to die before their fifth birthday (compared with a child born in a poor but stable country)
- about 30% of the young people aged 15-24 are illiterate (compared with 7% in other poor countries)
The release of new data on the effects of conflict on development could not be more timely.
In the UK, today also marks the release of the British government's aid reviews. While a number of countries will no longer receive UK assistance, the reviews echo the commitment by the international development secretary, Andrew Mitchell, to increase aid to "conflict states".
But while the Unesco report examines the effects of conflict on education, it criticises donor countries for skewing assistance towards a small group of "strategic" countries while neglecting the world's other equally poor and equally conflict-affected countries. While aid for basic education increased more than fivefold in Afghanistan during the past five years, for example, it stagnated or declined in other conflict-affected countries, such as Ivory Coast.
Beyond this year's special focus on conflict, the Unesco report also updates the world's data looking at progress towards key international targets on education.
Globally, more children are going to school than ever before but, according to the report, the number of children out of school is falling far too slowly, and progress is far too varied across the different regions of the world.
Some key findings:
- From 1999 to 2008, an additional 52 million children enrolled in primary school. But in 2008, there were still 67 million primary-school age children out of school around the world
- Half-of the world's out-of-school children live in just 15 countries. The largest population of out-of-school children is in Nigeria (8.3 million), followed by Pakistan (7.3 million), India (5.6 million), Ethiopia (2.7 million), and Bangladesh (2 million)
- In sub-Saharan Africa, about 10 million children drop out of school every year
- About 17% of the world's adults – 796 million people – lack basic literacy skills, and nearly two-thirds are women
- The majority of illiterate adults lives in just 10 countries. The largest population of illiterate adults is in India (283 million), followed by China (67 million), Pakistan (51 million), Bangladesh (49 million) and Nigeria (35 million).
The report includes projections for key indicators on education progress, and finds that – based on current trends – there could be more children out of school in 2015 than there are today.
It also points to key capacity gaps – for example, that another 1.9 million teachers will be needed by 2015 to achieve universal primary education.
The report also includes data on money for education – from the amount of public spending at the national level to the amount of international aid to education in developing countries.
So how do the world's education statistics breakdown? We've pulled out some of the data from Unesco's mammoth 2011 report.
What can you do with the data?
Data summary
Global spending on education
Global progress towards international education targets is mixed: See how countries compare on school enrolment, literacy, and teacher capacity
|
Country or Region
|
Primary education enrolment school year ending in 2008 (%)
|
Adult literacy rate (ages 15 and over) 2005–2008
|
Pupil/teacher ratio in primary education for school year ending 2008
|
|
|
|
| World |
87.64 |
83 |
25.02 |
|
| Algeria |
94.86 |
73 |
23.23 |
|
| Bahrain |
97.85 |
91 |
... |
|
| Djibouti |
41.23 |
… |
34.03 |
|
| Egypt |
93.62 |
66 |
27.08 |
|
| Iraq |
... |
78 |
... |
|
| Jordan |
89.49 |
92 |
... |
|
| Kuwait |
87.61 |
94 |
9.11 |
|
| Lebanon |
90 |
90 |
13.95 |
|
| Libyan Arab Jamahiriya |
... |
88 |
... |
|
| Mauritania |
76 |
57 |
39 |
|
| Morocco |
89.47 |
56 |
26.53 |
|
| Occupied Palestinian Territory |
75.31 |
94 |
29 |
|
| Oman |
68.26 |
87 |
11.87 |
|
| Qatar |
... |
93 |
12.5 |
|
| Saudi Arabia |
84.55 |
86 |
10.75 |
|
| Sudan |
... |
69 |
38.38 |
|
| Syrian Arab Republic |
... |
84 |
17.84 |
|
| Tunisia |
97.71 |
78 |
17.28 |
|
| United Arab Emirates |
91.58 |
90 |
17.19 |
|
| Yemen |
72.68 |
61 |
... |
|
| Albania |
... |
99 |
... |
|
| Belarus |
94.4 |
100 |
15 |
|
| Bosnia and Herzegovina |
... |
98 |
... |
|
| Bulgaria |
95.81 |
98 |
16 |
|
| Croatia |
90.25 |
99 |
17 |
|
| Czech Republic |
89.59 |
… |
18 |
|
| Estonia |
94.33 |
100 |
12 |
|
| Hungary |
89.69 |
… |
10 |
|
| Latvia |
... |
100 |
11 |
|
| Lithuania |
92.16 |
100 |
13 |
|
| Montenegro |
... |
… |
... |
|
| Poland |
95.57 |
… |
11 |
|
| Republic of Moldova3,4 |
87.72 |
98 |
16 |
|
| Romania |
90.31 |
98 |
16 |
|
| Russian Federation5 |
... |
100 |
17 |
|
| Serbia3 |
94.78 |
… |
17 |
|
| Slovakia |
... |
… |
17 |
|
| Slovenia |
96.96 |
100 |
17 |
|
| The former Yugoslav Rep. of Macedonia |
86.5 |
97 |
18 |
|
| Turkey |
94.69 |
89 |
... |
|
| Ukraine |
88.88 |
100 |
16 |
|
| Armenia |
84.08 |
100 |
19.31 |
|
| Azerbaijan3,6 |
96 |
100 |
11.3 |
|
| Georgia |
98.72 |
100 |
8.68 |
|
| Kazakhstan |
90.34 |
100 |
16.41 |
|
| Kyrgyzstan |
83.53 |
99 |
24.2 |
|
| Mongolia |
88.68 |
97 |
31.15 |
|
| Tajikistan |
97.33 |
100 |
22.67 |
|
| Turkmenistan |
... |
100 |
... |
|
| Uzbekistan |
88 |
99 |
17.61 |
|
| Australia |
97 |
… |
... |
|
| Brunei Darussalam |
93.29 |
95 |
13 |
|
| Cambodia |
88.59 |
78 |
49 |
|
| China7 |
... |
94 |
18 |
|
| Cook Islands3 |
... |
… |
16 |
|
| Democratic People's Republic of Korea |
... |
100 |
... |
|
| Fiji |
89.47 |
… |
26 |
|
| Indonesia |
95.7 |
92 |
17 |
|
| Japan |
100 |
… |
18 |
|
| Kiribati3 |
... |
… |
25 |
|
| Lao People's Democratic Republic |
82.42 |
73 |
30 |
|
| Macao, China |
87 |
93 |
17 |
|
| Malaysia |
96.1 |
92 |
15 |
|
| Marshall Islands3 |
66.3 |
… |
... |
|
| Micronesia (Federated States of) |
... |
… |
17 |
|
| Myanmar |
... |
92 |
29 |
|
| Nauru |
72.3 |
… |
22 |
|
| New Zealand |
99 |
… |
15 |
|
| Niue3 |
... |
… |
... |
|
| Palau3 |
... |
… |
... |
|
| Papua New Guinea |
... |
60 |
36 |
|
| Philippines |
92 |
94 |
34 |
|
| Republic of Korea |
98.75 |
… |
24 |
|
| Samoa |
93 |
99 |
32 |
|
| Singapore8 |
... |
94 |
19 |
|
| Solomon Islands |
67.01 |
… |
... |
|
| Thailand |
90 |
94 |
16 |
|
| Timor-Leste |
75.94 |
… |
41 |
|
| Tokelau |
... |
… |
... |
|
| Tonga |
99 |
99 |
22 |
|
| Tuvalu3 |
... |
… |
... |
|
| Vanuatu |
... |
… |
24 |
|
| Viet Nam8 |
... |
92 |
20 |
|
| Anguilla9 |
92.74 |
… |
14 |
|
| Antigua and Barbuda3 |
87.97 |
99 |
17 |
|
| Argentina |
... |
98 |
16 |
|
| Aruba |
99.11 |
98 |
17 |
|
| Bahamas |
91.3 |
… |
16 |
|
| Barbados8 |
... |
… |
13 |
|
| Belize |
97.71 |
… |
23 |
|
| Bermuda3 |
92.25 |
… |
8 |
|
| Bolivia, Plurinational States of |
93.67 |
91 |
24 |
|
| Brazil10 |
94 |
90 |
23 |
|
| British Virgin Islands3 |
93.34 |
… |
14 |
|
| Cayman Islands3,9 |
84.52 |
99 |
12 |
|
| Chile |
94.38 |
99 |
25 |
|
| Colombia |
90.02 |
93 |
29 |
|
| Costa Rica |
... |
96 |
19 |
|
| Cuba |
99 |
100 |
9 |
|
| Dominica3 |
72.25 |
… |
17 |
|
| Dominican Republic |
80 |
88 |
20 |
|
| Ecuador |
96.9 |
84 |
23 |
|
| El Salvador |
94.05 |
84 |
33 |
|
| Grenada |
93.39 |
… |
23 |
|
| Guatemala |
95.07 |
74 |
29 |
|
| Guyana |
94.68 |
… |
26 |
|
| Haiti |
... |
… |
... |
|
| Honduras |
96.57 |
84 |
33 |
|
| Jamaica |
80.23 |
86 |
... |
|
| Mexico |
98 |
93 |
28 |
|
| Montserrat3,8 |
92.32 |
… |
16 |
|
| Netherlands Antilles |
... |
96 |
... |
|
| Nicaragua |
91.83 |
78 |
29 |
|
| Panama |
98.27 |
94 |
24 |
|
| Paraguay |
90 |
95 |
... |
|
| Peru |
94.44 |
90 |
21 |
|
| Saint Kitts and Nevis8 |
... |
… |
16 |
|
| Saint Lucia |
91.49 |
… |
21 |
|
| Saint Vincent and the Grenadines |
94.63 |
… |
17 |
|
| Suriname |
90.12 |
91 |
16 |
|
| Trinidad and Tobago |
91.81 |
99 |
17 |
|
| Turks and Caicos Islands9 |
... |
… |
... |
|
| Uruguay |
97.51 |
98 |
16 |
|
| Venezuela, Bolivarian Republic of |
90.08 |
95 |
16 |
|
| Andorra3 |
80.12 |
… |
10 |
|
| Austria |
... |
… |
12 |
|
| Belgium |
98.41 |
… |
11 |
|
| Canada |
... |
… |
... |
|
| Cyprus3 |
98.7 |
98 |
15 |
|
| Denmark |
95.62 |
… |
... |
|
| Finland |
96 |
… |
14 |
|
| France11 |
98.44 |
… |
19 |
|
| Germany |
98.25 |
… |
13 |
|
| Greece |
99.4 |
97 |
10 |
|
| Iceland |
98 |
… |
10 |
|
| Ireland |
97 |
… |
16 |
|
| Israel |
97.06 |
… |
13 |
|
| Italy |
98.63 |
99 |
10 |
|
| Luxembourg |
95.66 |
… |
12 |
|
| Malta |
91.42 |
92 |
... |
|
| Monaco3,9 |
... |
… |
... |
|
| Netherlands |
98.75 |
… |
... |
|
| Norway |
98.68 |
… |
... |
|
| Portugal |
98.87 |
95 |
12 |
|
| San Marino9 |
... |
… |
6 |
|
| Spain |
99.76 |
98 |
12 |
|
| Sweden |
94.63 |
… |
10 |
|
| Switzerland |
94.18 |
… |
13 |
|
| United Kingdom |
99.59 |
… |
18 |
|
| United States |
91.97 |
… |
14 |
|
| Afghanistan |
... |
… |
42.96 |
|
| Bangladesh |
85.46 |
55 |
43.73 |
|
| Bhutan |
87.38 |
53 |
27.7 |
|
| India |
89.81 |
63 |
... |
|
| Iran, Islamic Republic of12 |
... |
82 |
20.05 |
|
| Maldives |
96.22 |
98 |
13.26 |
|
| Nepal8 |
... |
58 |
33 |
|
| Pakistan |
66.13 |
54 |
40.67 |
|
| Sri Lanka |
99.48 |
91 |
23.5 |
|
| Angola |
... |
70 |
... |
|
| Benin |
92.82 |
41 |
44.55 |
|
| Botswana |
87.22 |
83 |
25.39 |
|
| Burkina Faso |
63.34 |
29 |
48.9 |
|
| Burundi |
99.36 |
66 |
52 |
|
| Cameroon |
88.3 |
76 |
46.04 |
|
| Cape Verde |
84.43 |
84 |
24.36 |
|
| Central African Republic |
66.66 |
55 |
94.61 |
|
| Chad |
... |
33 |
62.49 |
|
| Comoros |
... |
74 |
30.15 |
|
| Congo |
58.91 |
… |
51.8 |
|
| Côte d'Ivoire |
... |
55 |
41.89 |
|
| Democratic Rep. of the Congo |
... |
67 |
39.02 |
|
| Equatorial Guinea |
... |
93 |
27.62 |
|
| Eritrea |
38.88 |
65 |
47.39 |
|
| Ethiopia |
78.17 |
36 |
59.32 |
|
| Gabon |
... |
87 |
... |
|
| Gambia |
68.74 |
45 |
34.36 |
|
| Ghana |
77 |
66 |
32 |
|
| Guinea |
71.34 |
38 |
44.11 |
|
| Guinea-Bissau |
... |
51 |
62.23 |
|
| Kenya |
81.52 |
86 |
46.54 |
|
| Lesotho |
72.73 |
90 |
36.98 |
|
| Liberia |
... |
58 |
23.88 |
|
| Madagascar |
98.46 |
71 |
47.16 |
|
| Malawi |
90.62 |
73 |
... |
|
| Mali |
72.9 |
26 |
50.15 |
|
| Mauritius |
94 |
88 |
22 |
|
| Mozambique |
79.89 |
54 |
64.06 |
|
| Namibia |
89.01 |
88 |
29.41 |
|
| Niger |
53.95 |
29 |
38.83 |
|
| Nigeria13 |
61.4 |
60 |
46.34 |
|
| Rwanda |
95.86 |
70 |
67.73 |
|
| Sao Tome and Principe |
96.11 |
88 |
26.17 |
|
| Senegal |
72.93 |
42 |
36.44 |
|
| Seychelles3 |
... |
92 |
13.05 |
|
| Sierra Leone |
... |
40 |
43.73 |
|
| Somalia |
... |
28 |
35.52 |
|
| South Africa |
87.47 |
89 |
30.98 |
|
| Swaziland |
82.78 |
86 |
32.44 |
|
| Togo |
94 |
65 |
41.34 |
|
| Uganda |
97 |
75 |
49.93 |
|
| United Republic of Tanzania |
99.34 |
73 |
52.24 |
|
| Zambia |
95.22 |
71 |
60.52 |
|
| Zimbabwe |
89.92 |
91 |
38.21 |
|
| Countries in transition |
90.86 |
100 |
16.78 |
|
| Developed countries |
95.24 |
99 |
14.26 |
|
| Developing countries |
86.71 |
79 |
27.52 |
|
| Arab States |
83.73 |
72 |
21.51 |
|
| Central and Eastern Europe |
93.01 |
98 |
17.72 |
|
| Central Asia |
90.38 |
99 |
16.98 |
|
| East Asia and the Pacific |
94.39 |
94 |
18.85 |
|
| East Asia |
94.61 |
94 |
18.84 |
|
| Pacific |
83.96 |
93 |
19.64 |
|
| Latin America and the Caribbean |
93.52 |
91 |
23.19 |
|
| Caribbean |
63.52 |
71 |
32.71 |
|
| Latin America |
94.74 |
92 |
22.92 |
|
| North America and Western Europe |
94.75 |
99 |
13.84 |
|
| South and West Asia |
85.65 |
62 |
38.83 |
|
| Sub-Saharan Africa |
76.13 |
62 |
45.35 |
|
• DATA: download the full spreadsheet
More data
Data journalism and data visualisations from the Guardian
World government data
• Search the world's government data with our gateway
Development and aid data
• Search the world's global development data with our gateway
Can you do something with this data?
• Flickr Please post your visualisations and mash-ups on our Flickr group
• Contact us at data@guardian.co.uk
• Get the A-Z of data
• More at the Datastore directory
• Follow us on Twitter
• Like us on Facebook

