A business dashboard is an information management tool that is used to track key performance indicators, metrics and a few key data points relevant to a business, department or specific process.
May 17, 2017

By Kent Bang, AgStar Financial Services
The amount of data that can be collected and analyzed on farms is nothing short of amazing. Most farms keep great records of farrowing performance and closeouts on every group of pigs marketed. It can be a bit overwhelming to try and capture all of it in a meaningful report to focus the attention on areas that are critical to improve in order to drive performance, cost and, ultimately business success. I believe it is helpful in any business to keep a “dashboard” of key drivers that help focus the attention on the big picture.
A business dashboard is an information management tool that is used to track key performance indicators (KPIs), metrics and a few key data points relevant to a business, department or specific process. Through the use of key data visualizations, dashboards simplify the complex to provide users with an overview of current performance.
Get more INSIGHT: Download 6 Ways to Manage Risk on your Hog Farm now!
The value of developing a dashboard for your farm is that it should help you define what is most important to the particular business, educate others in the business about things that matter, set goals and expectations for specific metrics, encourage specific actions in a timely manner, highlight exceptions and provide alerts when problems occur or continue, communicate progress and success, and to provide a common interface for analyzing important business data.
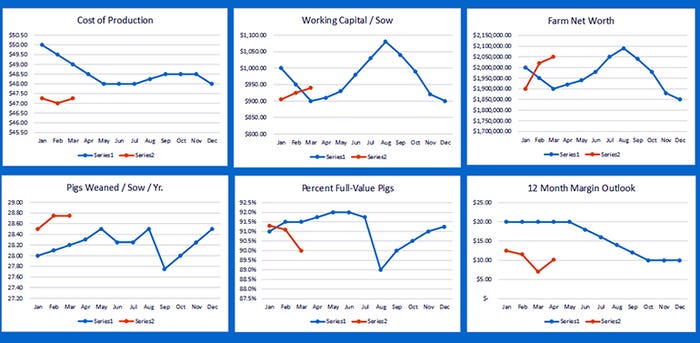
Here are six critical dashboard calculations that should be tracked on every farm and made available at regular intervals.
Cost of production
The cost of production should be captured as the key metric for most farms. Understanding the cost on a monthly basis is critical for staying on the right track and identifying changes to costs. Executing effective marketing strategies require that cost variation is understood. Other dashboard items might include weaned pig cost and wean-to-finish costs, or they may be areas you would drill down to from overall cost of production.
Working capital
Working capital is another key metric to track over time. With the volatility the pork production industry has, knowing this trend is paramount. As you have probably read or heard over time, AgStar Financial Services looks at this from a working capital per sow basis. If the number of sows is static, that wouldn’t be necessary for you to track, just tracking working capital would suffice. We also look at this with the breeding herd added to the current assets when they are financed with a revolving line of credit (which would be typical). Another metric that goes hand-in-hand with working capital might be to track Borrowing Base Margin. The two should be closely linked.
Net worth
Much like working capital, establishing a dashboard for net worth helps to track success of the overall business. It is important for most to establish some guidelines for capital spending in relation to both net worth and working capital.
Farrow-to-wean productivity
This may be as simple as using a dashboard for pigs weaned per sow per year. After all, this is not designed to replace your Performance Monitor, rather it would be intended to have a concise, easy-to-review single report with several key metrics. If there were identified weakness in the performance monitor, one may want to include total born per sow per year, pigs weaned per sow per year and breeding herd mortality as separate dashboard items.
Wean-to-finish productivity
This particular metric seems to be harder to define for a broad audience, but once you understand current performance and identify actionable items, it should become easier to do for your farm. From my perspective, this should include percent pigs sold to your primary market as a percentage of the pigs weaned or placed. Other metrics would include utilization of nursery or wean to finish space, gain and conversion, and perhaps the percentage of pigs hitting the packer box.
Forward looking margins
A snapshot of what the next six to 12 months looks like would be an excellent dashboard addition. Many of you have this based on current estimated future sales, the futures market and what is hedged or price protected in that period of time. A snapshot of what open market margins look like with what you have priced should be a key metric that you would review frequently to help with marketing decisions.
Your farm dashboard might look like the following, but could be adapted to your most important KPIs.

You May Also Like


