July 2016 Market Report: Four Years of Recovery, Still 4+ Percent Left to Go
The median U.S. home value has risen on an annual basis in each month for the past four years – and still remains more than 4 percent below its pre-recession high.
The median U.S. home value has risen on an annual basis in each month for the past four years – and still remains more than 4 percent below its pre-recession high.
The median U.S. home value has risen on an annual basis in each month for the past four years – and still remains more than 4 percent below its pre-recession high.
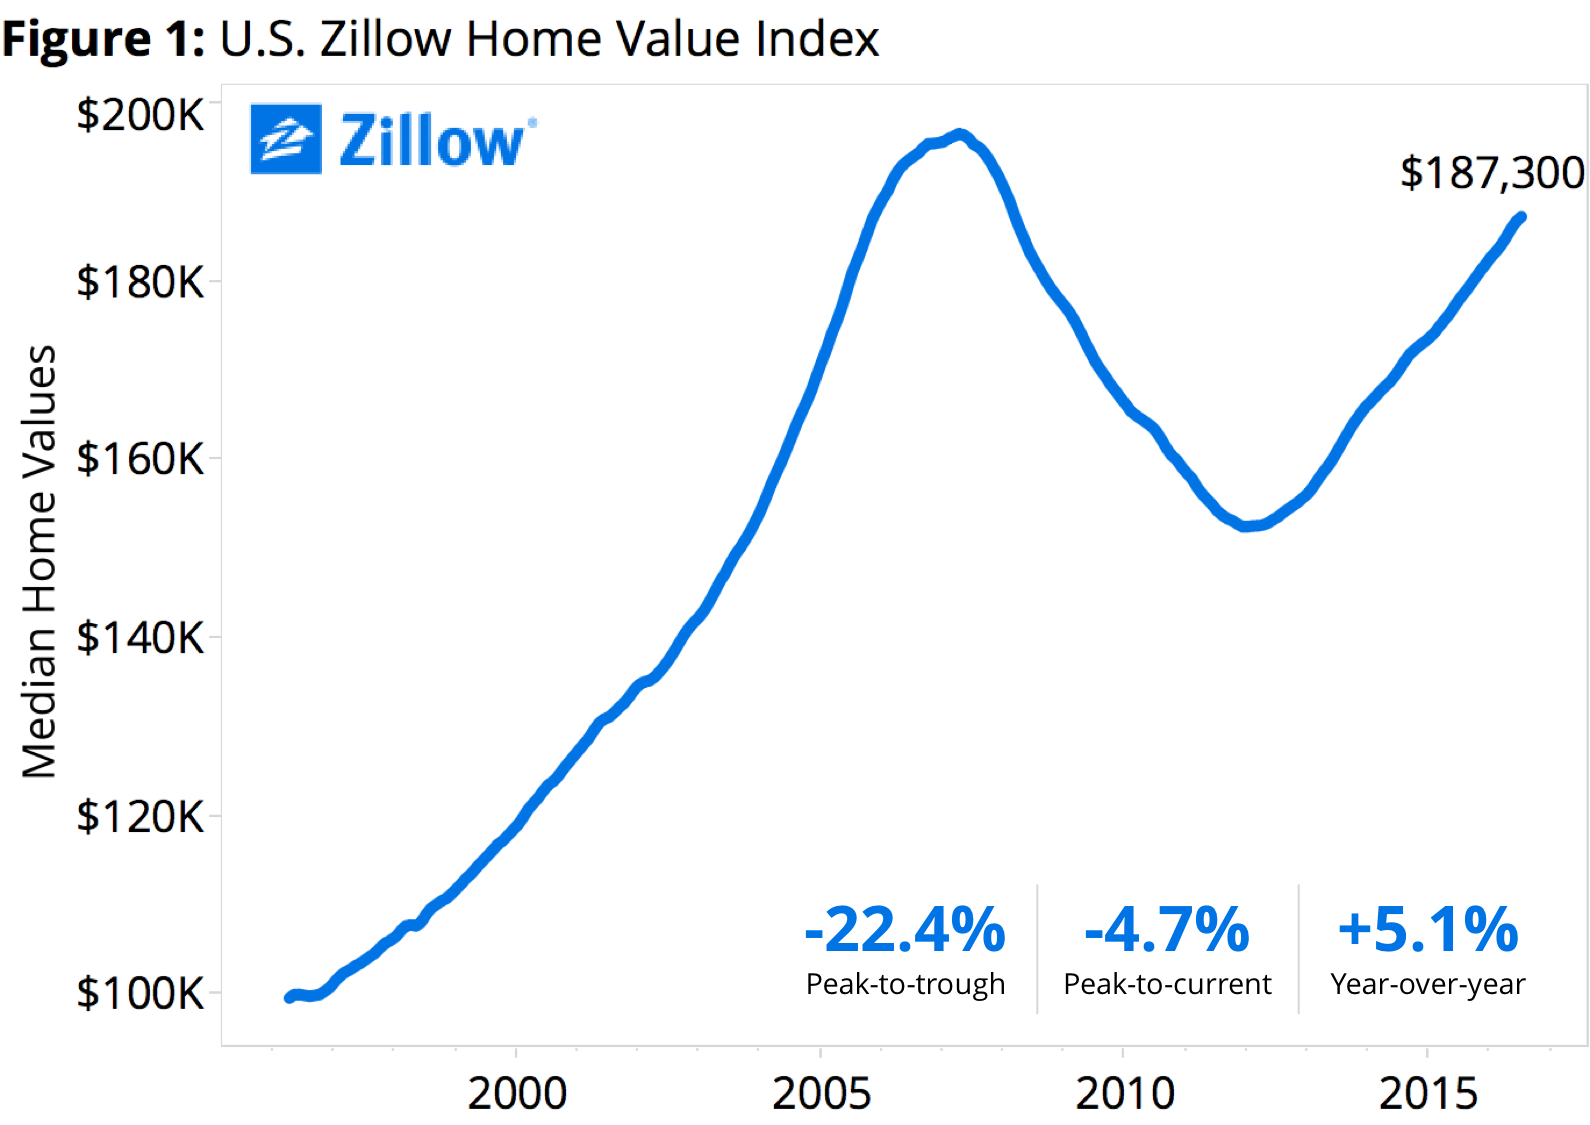 For the 48th month in a row, the median home value rose year-over-year in July, to a Zillow Home Value Index of $187,300, up 0.3 percent from June and 5.1 percent from July 2015, according to Zillow’s July Real Estate Market Report. The median U.S. home value peaked at $196,600 in April 2007 (figure 1). Currently, the typical U.S. home is worth 4.7 percent less than it was prior to the recession – and is not expected to re-gain all value lost in the recession until late 2017 or potentially later.
On first blush, it may be hard to believe that after four years of growth, the market is still not back to pre-recession highs. But that kind of hot-take reaction ignores both the length and depth of the housing recession, and the strength of the boom that preceded it. Between April 1997 and August 2008, home values grew year-over-year for 125 consecutive months, more than a decade of continuous growth. And between September 2007 and July 2012, home values fell year-over-year for 59 straight months – almost five straight years of declines.
At its strongest, annual home value appreciation reached an 11.4 percent pace in three separate months during the housing boom (July, October and November of 2005). At the outset of the recession, the median U.S. home lost 7.4 percent of its value year-over-year during the worst month (October 2008). Since entering recovery mode, the pace of annual U.S. home value growth topped out at 6.5 percent in January 2014. In other words, the strongest month of annual growth experienced so far in this recovery failed to match both the fastest pace of annual growth recorded during the boom and the largest one-month annual decline recorded during the bust.
But looking locally at July data paints a different picture. Portland, Dallas and Denver reported the highest year-over-year home value appreciation in July among the 35 largest metros across the country. In Portland, home values rose almost 15 percent to a median value of $334,900. Home values in Dallas and Denver rose 11.9 and 11.3 percent, respectively. In notoriously expensive San Francisco, home values have been slowing down since the beginning of the year. In January, home values were up almost 12 percent year-over-year and are now appreciating at about half that pace, up 6.6 percent over the past year.
And while the Pacific Northwest may be red hot, with a booming job market that’s attracting lots of new residents, parts of the Midwest are still struggling to shake off the hangover from the recession (figure 2). Home values in Indianapolis actually fell year-over-year in July, down 3.5 percent from a year ago to a Zillow Home Value Index of $130,800 – the only large U.S. metro to experience home value declines. Annual home value growth in Cleveland, Columbus, Chicago, Cincinnati and St. Louis was slower in July than the U.S. average. And despite periods of very rapid growth over the past few years, home values fell so far in certain Southwestern and Southeastern U.S. markets that they won’t be near peak levels again for years. Median home values in Las Vegas, Orlando, Riverside, Miami and Tampa are all more than 20 percent below pre-recession peaks, despite all growing faster than the U.S. average in July.
So, give the U.S. recovery time. And always remember, slow and steady wins the race – and lest anyone be tempted to forget this, look no further than what happened to housing a decade ago to remember the perils of growing too much, too fast. But while the U.S. market slowly trudges back to equilibrium, a number of diverging trends are emerging in markets nationwide that prove that real estate is all about location, and that the national market is really just a collection of smaller local and regional markets.
In July, national median rents rose 2.2 percent year-over-year to $1,408 per month, according to the Zillow Rent Index. Similar to home values, on an annual basis, U.S. rents have risen or remained flat for 48 consecutive months (figure 3).
Rents rose year-over-year in July in all 35 of the country’s largest markets. Seattle, Portland and San Francisco reported the highest year-over-year rent appreciation. In Seattle, rents rose almost 10 percent, to a median rent price of $2,052 per month, while rents in Portland rose just over 8 percent. In San Francisco, the median rent price rose to $3,407 per month, second-highest among all U.S. metros, right after San Jose, CA. Rents in San Francisco appreciated 6 percent over the past year.
The number of homes for sale nationwide as of the end of July was down 4.9 percent from the same time a year earlier, and was down year-over-year in 24 of the largest 35 metro markets (figure 4). The number of homes for sale nationwide has fallen on an annual basis in each of the past 18 months, and in 47 of the past 56 months.
Looking ahead, Zillow expects national home values to continue growing, rising another 2.4 percent through July 2017 to a Zillow Home Value Index of $191,806. U.S. rents are also expected to keep growing over the next year, at a 2.1 percent pace through July 2017 to a Zillow Rent Index of $1,437.
The consistent rise in home values that we’ve been seeing for the past four years nationally masks a number of region-specific trends and shifts that have taken place over the past few months. In most areas, the market is being driven mainly by a strong labor market and tight supply, especially among entry level homes that first time buyers are after. But some markets – especially the red-hot Pacific Northwest – are adding more jobs and attracting more residents, putting the pressure on home values and rents there. The Bay Area and Southern California are still growing at a faster pace than the nation as a whole, but growth rates have come back to earth a bit after several years of rapid growth. And markets in other regions, like the Northeast, just keep steadily chugging along.
All housing is local, and as the local economies in individual metros ebb and flow, housing will follow suit. More than at any time since the boom and bust, we’re seeing a housing market that is driven by local fundamentals, and not by national trends.
