Security testing is performed to ensure that the data within an information system is protected and not accessible by unauthorized users. It protects applications against serious malware and other unanticipated threats that may crash the application. It helps to figure out all the loopholes and weaknesses of the system in the initial stage and ensures that the application has encoded security code. Security testing mainly covers the below critical areas:
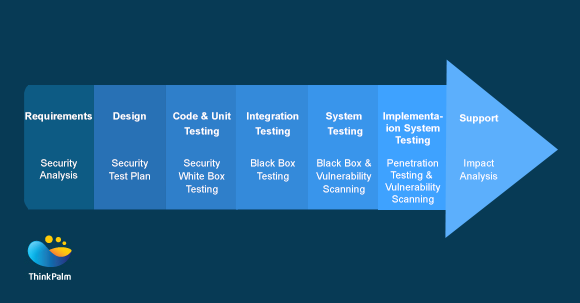
The following security considerations need to be performed for every phase in the software development life cycle:
Security testing helps avoid:
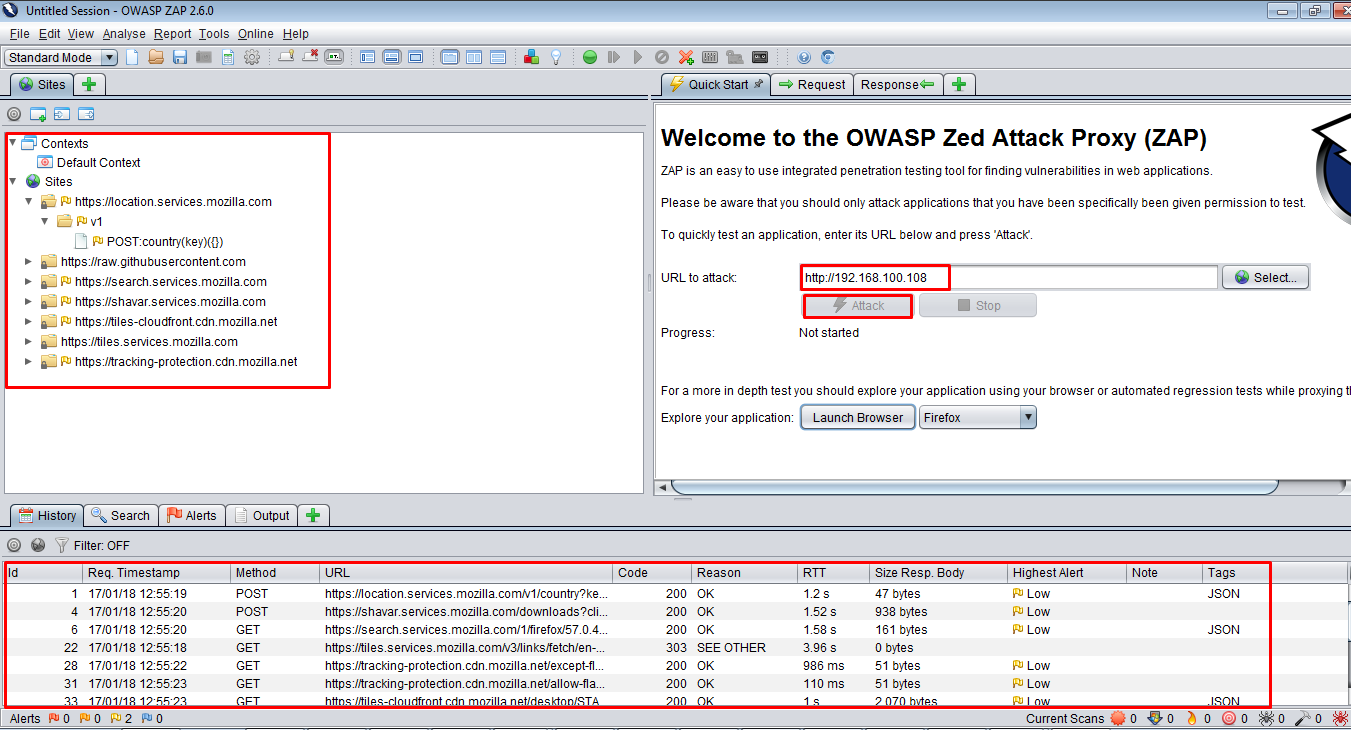
It is an open source tool designed to help security professionals to find out the security vulnerabilities present in web applications. It has been developed to run on Windows, Unix/Linux and Macintosh platforms. It can be used as a scanner/filter of web pages. Its top features are Intercepting Proxy, Passive Scanning, Automated Scanner and a REST based API.
Link for download — https://www.owasp.org/index.php/OWASP_Zed_Attack_Proxy_Project
The application is dedicated to providing information about application security. The OWASP top 10 web application security risks, commonly found in web applications are Funct Access Control, SQL Injection, Broken Auth/Session, Direct Object Ref, Security Misconfig, Cross Site Request Forgery, Vulnerable Components, Cross Site Scripting, Unvalidated Redirects and Data Exposure. These top ten risks will make the application harmful because they may allow the stealing of data or completely take over your web servers.
We can execute OWASP using GUI as well as command prompt:
The other option to execute OWASP:
GUI screenshot:
It is a tool used for performing security testing of web applications. It has professional and community editions. With over a 100 predefined vulnerability conditions, it ensures the safety of applications by applying these predefined conditions to figure out vulnerabilities.
Coverage:
Burp Suite itself has more than 100+ predefined test conditions like SQL injection, cross-site scripting (XSS), Xpath injection and more and applies these conditions to code for every execution. Scanning can be performed at different levels of speed such as fast, normal and more. Using this tool, we can scan an entire application or a particular branch of a site, or an individual URL.
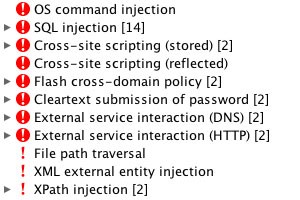
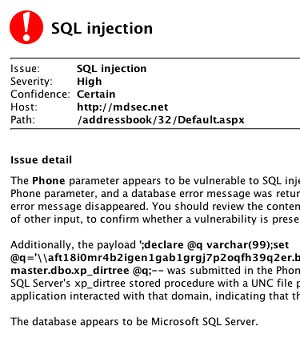
Clear vulnerability presentation:
Burp suite presents the result in a tree view. We can drill down to the details of the individual items by selecting a branch or a node. The scanned result comes up in red if any vulnerability is found. Vulnerabilities are marked with confidence and severity for easy decision making. Detailed custom advisories are available for all reported vulnerabilities with a full description of the issue, confidence type, issue severity and path of the file. HTML reports can be downloaded.
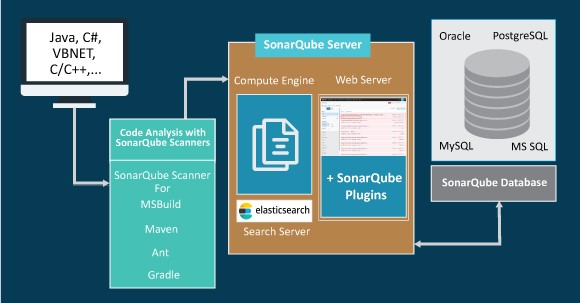
It is an open source tool to measure the quality of source code. Though written in Java, it can analyze over twenty different programming languages. It can easily integrate with continuous integration tools such as Jenkins server. The results will be populated to SonarQube server with ‘green’ and ‘red lights’. Visually applealing charts and project level issue lists can be viewed. We can invoke it from GUI as well as command prompt.
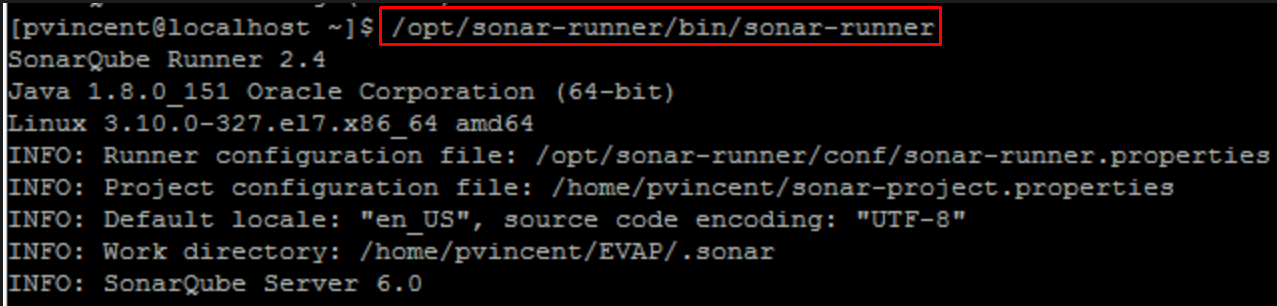
After the successful execution of the SonarQube Runner, you can find the results in http://localhost:9000 web page.
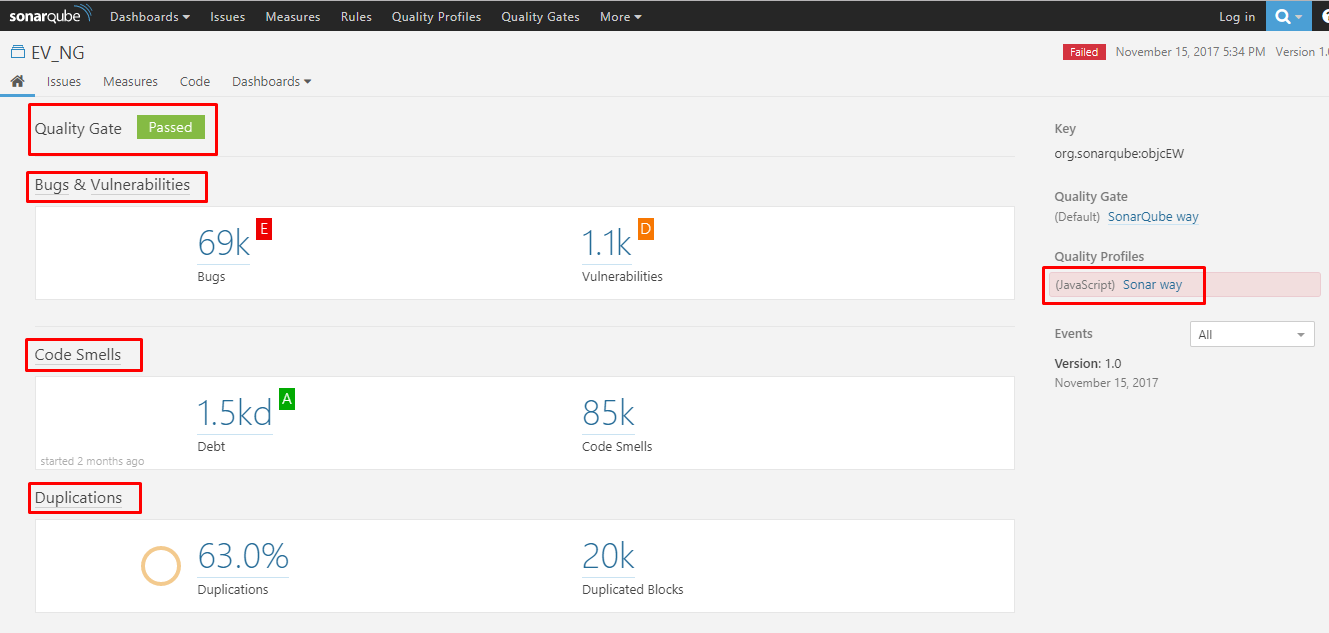
Project wise home page:
This tool classifies bugs by various conditions like Bugs, vulnerabilities, code smells, code duplication and beyond.
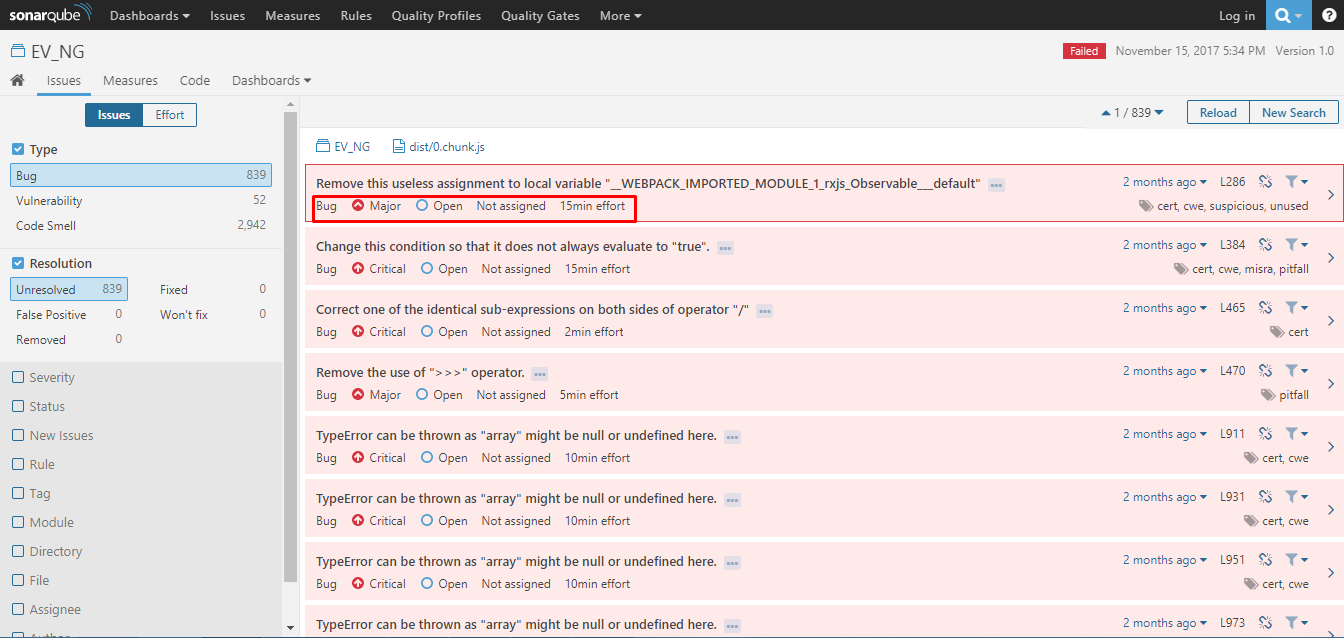
Issue list:
We will be navigated to the issue list page if we click on bug count in the project dashboard. Bugs will be listed with severity, status, assignee, reported time and time taken to fix the issue.
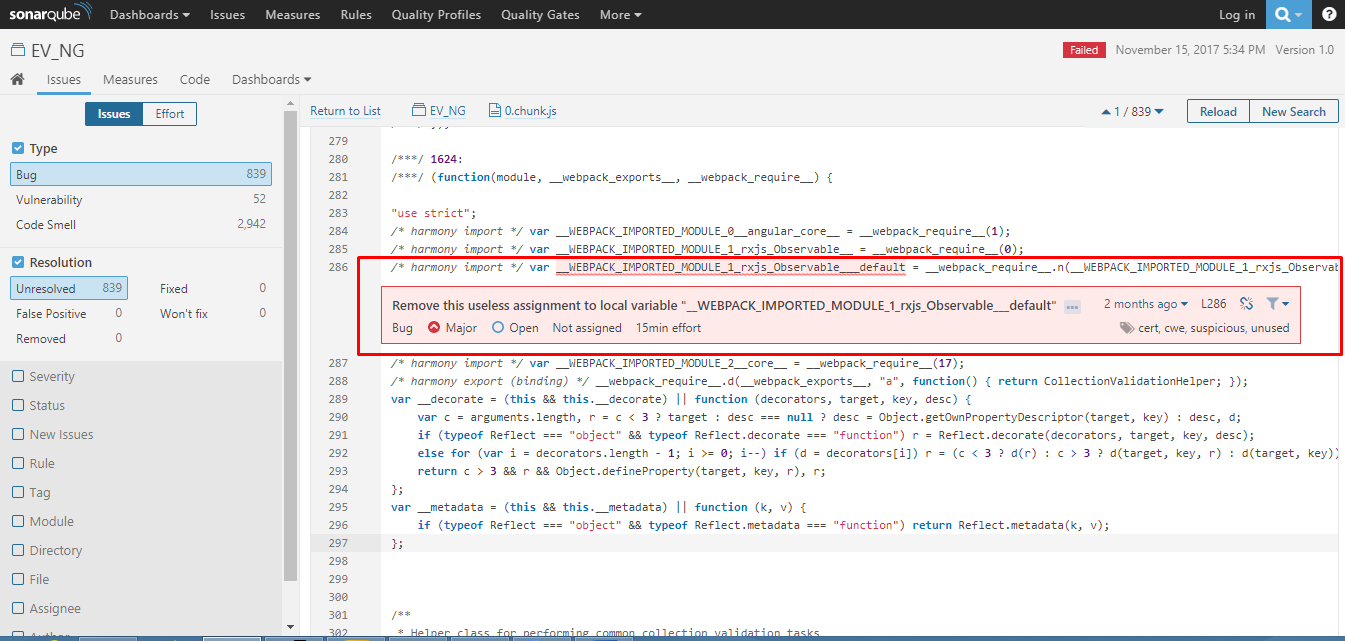
Detect tricky issues:
Issue code will be marked in red and suggestions can be found to fix the issue quickly.
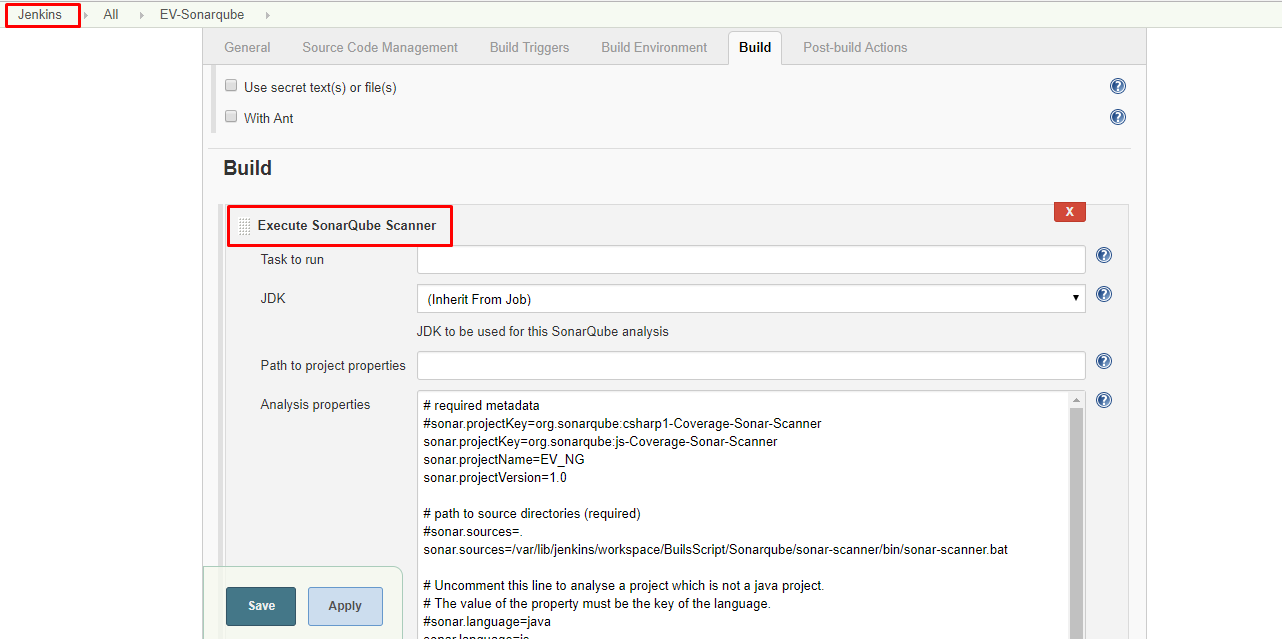
Integration with Jenkins:
Jenkins has a separate plugin to perform sonar scanner that uploads the result to SonarQube server once the testing is done.
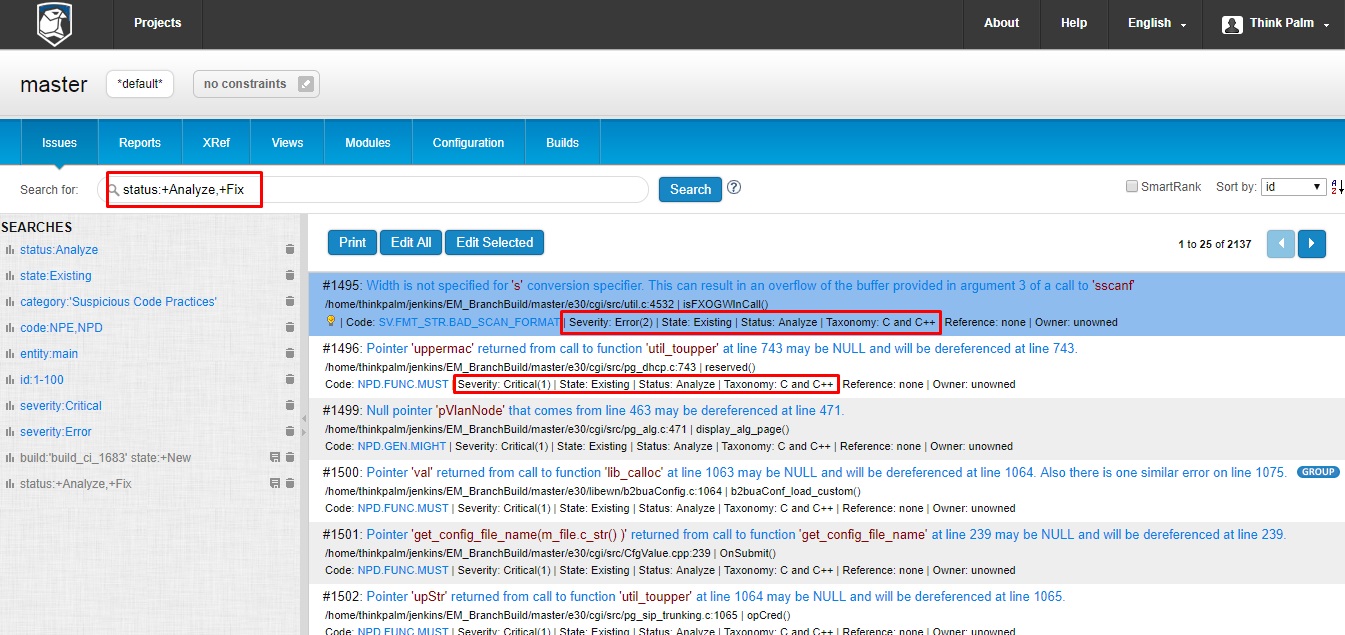
It is a code analysis tool that is used to identify security, safety and reliability issues of the programming languages C, C++, Java and C#. We can easily integrate it with continuous integration tools like Jenkins, and can raise bugs in Jira upon encountering new issues.
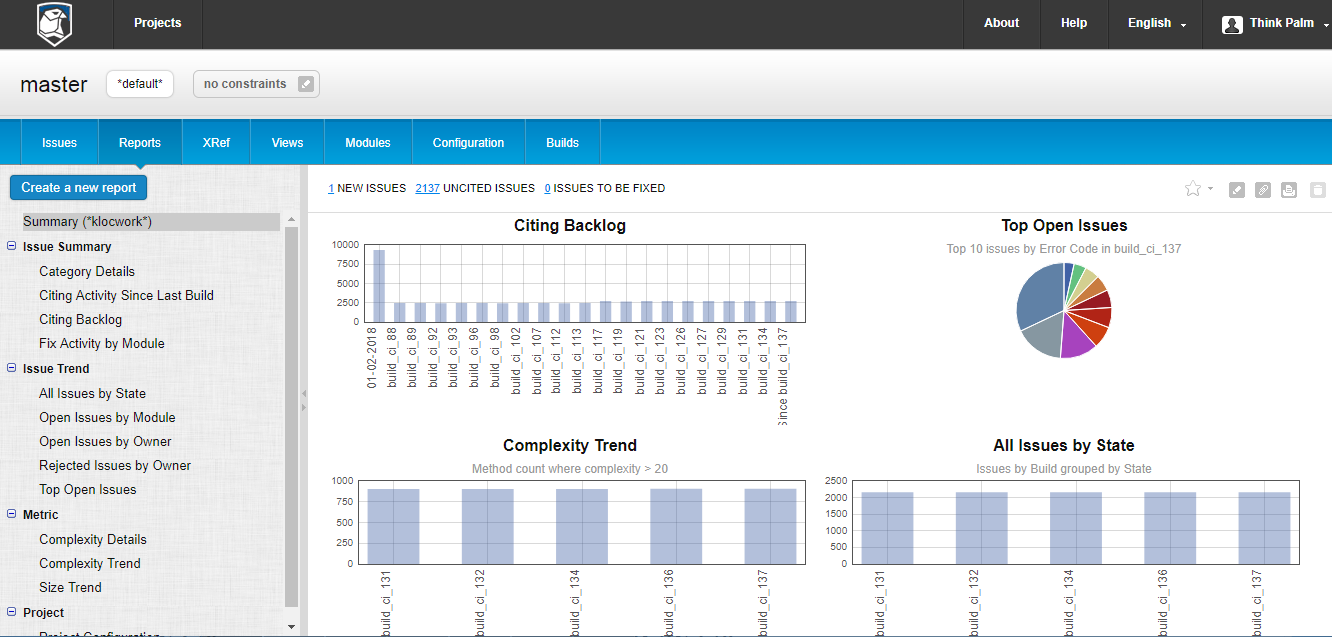
Project wise scanned result:
Printout of the result can be taken using the tool. In the home page, we can view all the scanned projects with ‘new’ and ‘existing’ issue count. The range and ratio of the issue can be viewed by clicking the ‘Report’ icon.
Detailed issue:
By entering various search conditions in the ‘search’ text box, we can filter the result. Issues are presented with severity, state, status and taxonomy fields. By clicking on the issue, we can find the line of issue.
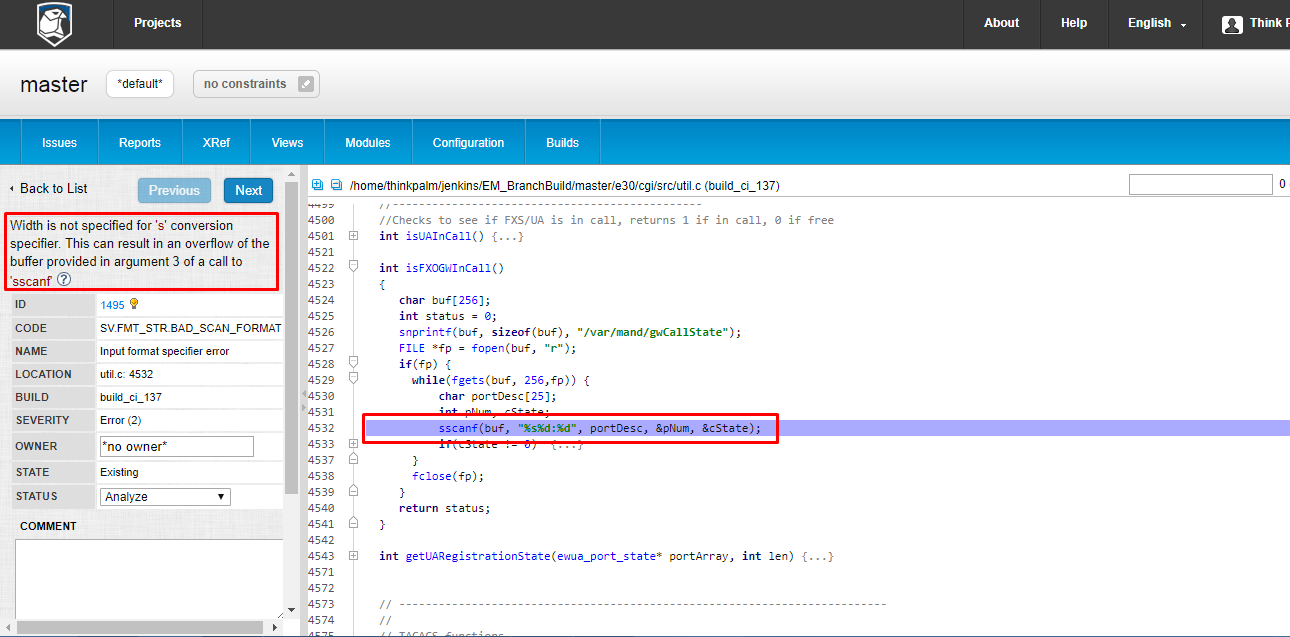
Mark the issue code:
For quick identification, Klocwork highlights the ‘line of code’ with the issue, cites the cause and suggests measures to overcome the same.
Export to Jira:
We can directly raise a Jira by clicking on “Export to Jira” button.
Integration with Jenkins:
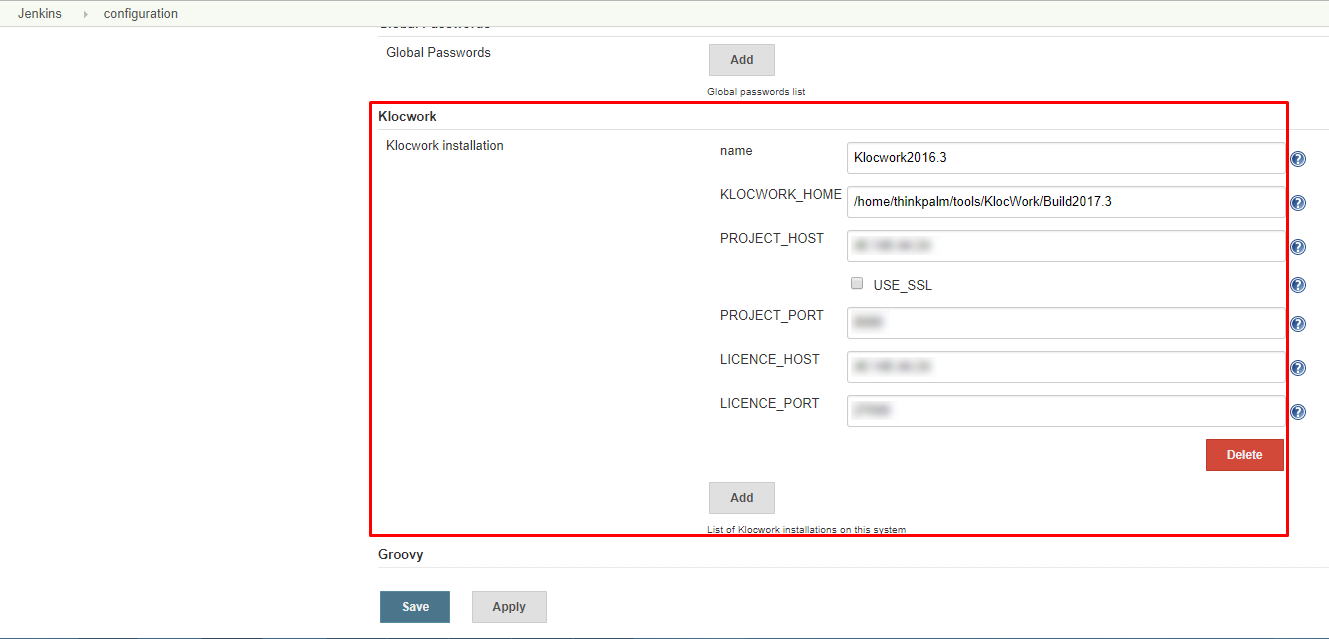
Jenkins has a plugin to integrate with Klocwork, To integrate, first we need to configure Klocwork details in Jenkins configure page. After that, Jenkins will take care of uploading the report to the Klocwork server whenever the execution gets completed.
Jenkins configuration for Klocwork