
46 Comments
NIH grants reflect research investments that we hope will lead to advancement of fundamental knowledge and/or application of that knowledge to efforts to improve health and well-being. In February, we published a blog on the publication impact of NIH funded research. We were gratified to hear your many thoughtful comments and questions. Some of you suggested that we should not only focus on output (e.g. highly cited papers), but also on cost – or as one of you mentioned “citations per dollar.” Indeed, my colleagues and I have previously taken a preliminary look at this question in the world of cardiovascular research. Today I’d like to share our exploration of citations per dollar using a sample of R01 grants across NIH’s research portfolio. What we found has an interesting policy implication for maximizing NIH’s return on investment in research.
To think about impact per dollar across the NIH research portfolio, let’s look at a sample of 37,909 NIH R01 grants that were first funded between 2000 and 2010. When thinking about citations per dollar, one important consideration is whether we are largely looking at human or non-human studies.
Table 1 shows some of the characteristics of these grants according to whether or not they included human subjects. Continuous variables are shown in the table in the format a b c, where a is the lower quartile, b is the median, and c is the upper quartile. The total award amount includes direct and indirect costs across all awarded years and is shown in 2015 constant dollars (with inflation adjustment by the BRDPI). “Prior NIH funding” refers to total NIH funding the PI received prior to this specific award.
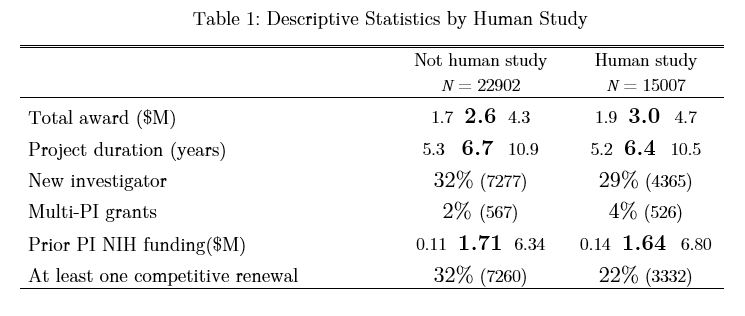
As might be expected, grants supporting research on human subjects were more expensive and more likely to involve multiple PI’s. Human studies were less likely to be renewed at least once.
Next, let’s look at publishing and citation outcomes for the same group of grants, broken out by whether the study involves humans are not. Similar to what I showed in my prior blog, I show a “normalized citation impact”, a citation impact measure that accounts for varying citation behavior across different scientific disciplines, but now divide that by total dollars spent. We’ll do this using box and violin plots to show the distribution of normalized citation impact per million dollars according to whether or not the grant included human subjects.
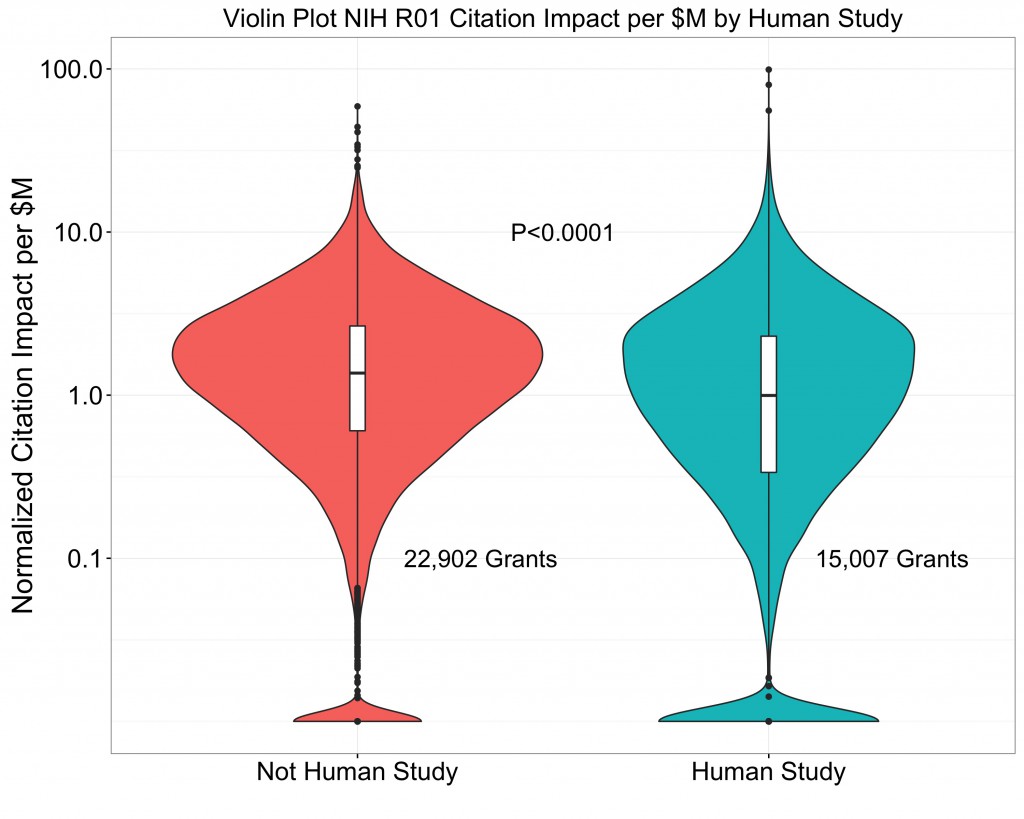
The shaded area shows the distribution of NIH-supported papers ranging from the most highly cited (100 percentile) to least cited. Note that the Y-axis is displayed on a logarithmic scale. This is an important point – scientific productivity follows a highly skewed “heavy-tailed” logarithmic distribution, not a simple normal distribution like human height. The log-normal distribution of grant productivity is evident, though with “tails” of grants that yielded minimal productivity. The log-normal distribution also reflects that there are a small – but not very small – number of grants with extraordinarily high productivity (e.g. those that produced the equivalent of 10 or more highly cited papers). We also see that by this measure, grants that focus on human studies– in aggregate – have less normalized citation impact per dollar than other grants.
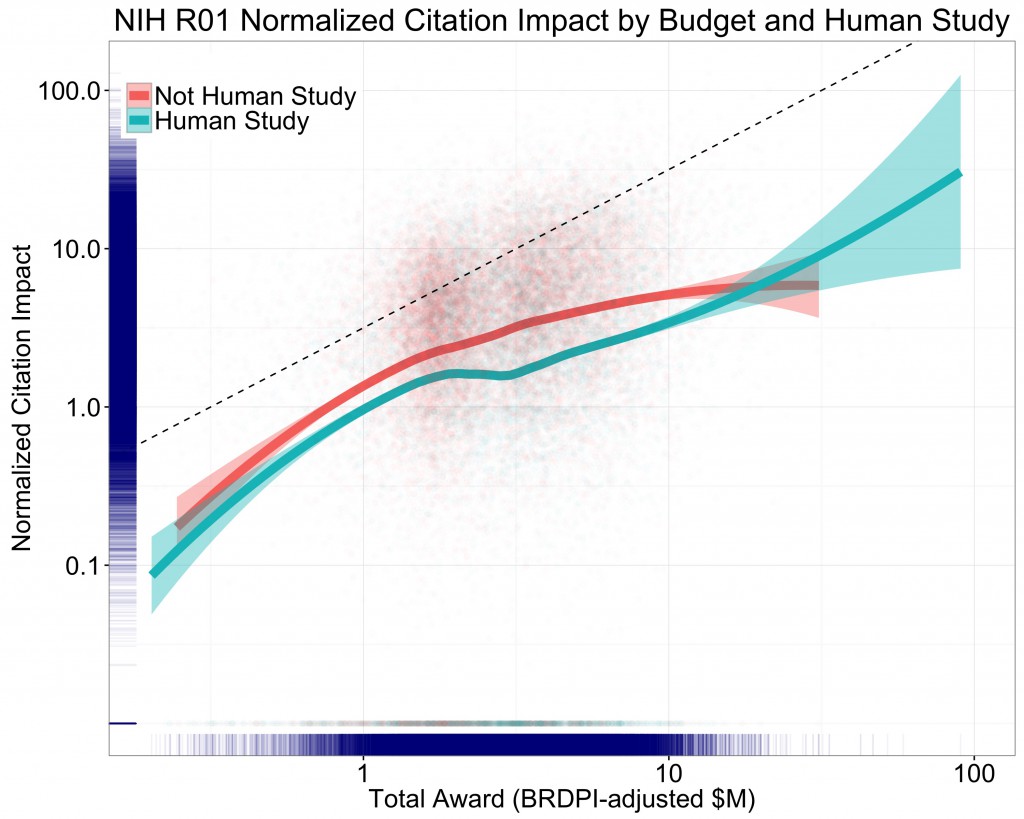
Another approach to describing the association of citation impact with budget is to produce a “production plot,” in which we examine how changes in inputs (in this case dollars) are associated with changes in output (in this case, citation impact). Figure 2 below shows such a production plot in which both axes (total award on the X-axis and citation impact on the Y-axis) are logarithmically scaled. This kind of plot allows us to ask the question, “does a 10% increase in input (here, total grant award funding) predict a 10% increase in output (citations, normalized as described earlier)?” If there is a 1:1 relationship between the input and the output, and a 10% increase in funding yields a 10% increase in citations, we’d expect a plot with a slope of exactly 1.The trendlines/curves are based on loess smoothers, with shaded areas representing 95% confidence intervals. We see that the association between the logarithm of grant citation impact and the logarithm of grant total costs is nearly linear. We also see that over 95% of the projects have total costs greater than $1 million, and less than $10 million for the lifetime of the grant, and in this range the association is linear with a slope of < 1 (whereas the dotted line which has a slope of exactly 1). Not only is this pattern consistent with prior literature, it is illustrative of an important point: Research productivity follows (to some extent) a “power law,” meaning that productivity is a function of the power of funding.
There are important policy implications of the power law as it applies to research. In cases in which power laws apply, extreme observations are not as infrequent as one might think. In other words, extreme events may be uncommon, but they are not rare. Extreme events in biomedical science certainly happen – from the discoveries of evolution and the genetic code to the development of vaccines that have saved millions (if not billions) of lives to the findings of the transformative Women’s Health Initiative Trial to the more recent developments in targeted treatments and immunotherapy for cancer. Because extreme events happen more often than we might think, the best way to maximize the chance of such extreme transformative discoveries is, as some thought leaders have argued, to do all we can to fund as many scientists as possible. We cannot predict where or when the next great discovery will happen, but we can predict that if we fund more scientists or more projects we increase our ability to maximize the number of great discoveries as a function of the dollars we invest.
what would be the outcome if the analysis were done by study section rather than by grant – since study sections are the gate keepers? It might be useful to look at five-year blocks going back 20 years, since review procedures and policies have changed significantly.
Please explain the violin plot a bit more. What is the x axis?
The x-axis is a histogram of the number of grants that have a specific Citation Index score. If you cut the violin in half and then turn it on its side (rotate 90 degrees), you’d have a standard histogram. In this case, on the log scale, it appears mostly normal with the exception of a large number of un-cited papers.
This analysis fails to consider the importance of multiple grants whether from the same institute or private funding that often is tremendously important in the long-term success of labs and the security to publish frequently. There is a big difference between a lab with one R01 only vs one R01 from NHLBI, one from NIAAD, and one private fund. Although aims may be separate they often overlap some, and provide security for employees, animal cost, and reagents.
I think this is a critical point. What I would like to see is the productivity of the investigator vs total NIH funding. A successful lab needs a certain amount of ‘capital’ to be able to take some risks and exploration that are essential to new discoveries. Similarly, there is a point at which the operation of a lab is too large to manage efficiently by one PI and some waste begins to be noticeable. What is the optimal funding level where the most significant output and ROI is evident? I would be very interested in seeing that analysis.
A useful control might be to look at citations per Nobel prize.
Numbers of citations rarely correlate with greatest discoveries but that criteria. Pushing for more publications per dollar creates the wrong incentive and could result in more irreprociblilty problems. Good science takes time and costs money.
Amen- academic science is not for profit industry and shouldn’t be judged the same way. It also may take years for the most innovative and ground breaking science to be accepted and thus published!
Can you explain how you dealt with science that was funded by multiple different sources ? Did you divide by fractional funding dollars from NIH and only attribute the fraction of the contribution?
I am thinking HHMI + NIH, DARPA + NIH, private foundations + NIH,etc.
Does science that was funded by multiple agency behave significantly differently ?
Interesting, and potentially important. I wonder how my grant support stacks up, but I don’t know how to normalize the citations. I do hope you used longer term citations and not just the short term impact factors that tend to be higher for trendy rather than lasting research.
Even without the actual data to support your conclusions one might have predicted this outcome. The more minds involved x the more good ideas that can be investigated = greater total insight in more areas. Throwing excessive funding at fewer individuals, regardless how talented they may be, will not yield the same breadth of results. PIs can responsibly pursue only a finite number of avenues before they lose real oversight of the projects, at which point further funding is not a good investment.
Have you looked at patent applications and patents granted per dollar?
There was a paper in Nature Biotech (June 2014) that broke the NIH down by patent output and citation rate, per Institute, from 2003-2012.
Interesting analysis, thanks!
I guess the lesson is: “Don’t put all your eggs in one basket.”
Does this apply to both PIs AND institutions?
The idea that you can monetize research papers is another bureaucratic nightmare. If you wanted more papers/$ I would write more, shorter papers. If you wanted only highly cited papers, I would argue that you might miss the most important papers that don’t fit current thinking. I have a better idea. Restrict authors to a limited number of papers to improve overall quality, and evaluate them 10 years later for their value to the field. That way you’ll have some perspective. How should we judge the productivity of your efforts?
The conclusion, “We cannot predict where or when the next great discovery will happen, but we can predict that if we fund more scientists or more projects we increase our ability to maximize the number of great discoveries as a function of the dollars we invest” is spot on. If there were sufficient funding to lower NIH paylines to fund the top 20th percentile biomedical science wouldn’t be facing the crisis that it is today: We write more grants than ever, have strained the peer review system to the breaking point, and are encouraged to spin our proposals to argue how they will challenge paradigms and change practices.
The low funding rates are due to a doubling of the biomedical applicant pool and trend toward bigger awards. Thus, the only way that funding rates are going back up is if the applicant pool shrinks or awards get smaller. PIs keep producing trainees and institutions keep hiring soft money researchers, so the applicant pool isn’t shrinking. NIH is trying to limit award sizes (this analysis is part of the search for how to do that). The elephant in the room is still indirect cost rates. But NIH is ultimately still a government organization driven by politics, and there are vey powerful institutions lobbying to keep indirect cost rates high.
Does this really indicate that the funding is fueling discovery or simply that the funding is an effect of discovery? Based on what I’ve seen from grants, which often present nearly polished papers, I believe it is probably the latter. It would be informative to know what portion of the highly cited discoveries occurred prior to the grant being awarded.
Is there any way to distinguish case and effect in this data?
I would say, close to 100%. Everybody knows that NIH awards R01s, as a matter of policy, when the proof-of-principle is presented and supported by strong preliminary data, and the SAs are mainly to test the discovery on a large cohort to bring it to statistical significance, to explore ramifications, and also to test how it is modified by, say, different therapeutic interventions. In my books, this means that the discovery has already been done before submission.
Three comments: 1) in human studies involving a highly-cited prevention intervention we found not only the “scientific productivity” impact, but “lab to streets” impact. Each of the participants in our study spoke to and advised at least 8 other people every two weeks about what the participants had learned over an extended time period. These “other” people were not in the study and informal dissemination persisted beyond the study’s end.
2) Routinely we build effect silos. Our study was on HIV prevention, but some of the behaviors which put people at risk (unhealthy relationship behavior, unhealthy substance use behavior) have multiple outcomes–more common STDs, homicide, suicide. domestic violence, teen pregnancy, etc, etc, etc. We rarely measure these unintended positive consequences (I can cite a Yale paper on cost effectiveness of HIV prevention that ignores other outcomes than HIV). We routinely look at other “root causes” (poor diet and exercise habits) for a multitude of health outcomes.
3) Finally, my favorite example: Haydn wrote 106 symphonies, Beethoven wrote 9. Haydn also was a composer/mentor to both Mozart and Beethoven. Now how do you measure productivity? Impact? Who do you fund? Or do you have more complex metrics? As the outstanding social scientist Donald T. Campbell stated, as soon as you make decisions based on one metric, for people, it will become corrupted.
Are the data and methods used for these graphs available? It would be helpful to say what happened to the zero citation grants (your y-axis is truncated). And what your smoother and its confidence band might mean. Or why a power is justified.
Given that some pretty major conclusions are drawn from the graphs, these details would help convince those who might suspect over-interpretation of noisy, observational data for which no pre-specification of analyses is apparent.
Nice job for this analysis. It is consistent with my observation: the bigger the group, the more waste of resources; the bigger the funding, the more waste of money. Funding more projects with less money (<~1M, see last figure where the slope is more than 1) is the way to go!
Interesting backward-looking analysis. Seems like a decent way to look at NIH funding overall but an awful way to look at individual grants, especially if one is trying to foster creativity and innovation.
“Citations per dollar” is a meaningless measure, considering that as much as 90% of publications are not reproducible (the exact number is hard to know, but there is clear evidence from multiple sources that number is very large
I’d say it is very meaningful. If publications are not reproducible they fall of the radar. Nowadays, thanks to research watchdog websites like PubPeer and Retraction Watch, researchers get to know of problem papers very quickly. Thus, citations will cease quite rapidly.Citation impact per paper is all more important now that the scientific literature is awash with sub-standard or fake publications spewed out by predatory journals.
How does your analysis deal with the fact that many journals limit the number of citations, forcing people to cite reviews as opposed to primary research papers? That is certainly going to affect citations per dollar. How did you weight citations of reviews versus primary research papers?
A problem with this approach is you never really know how much of a grant award was actually spent in support of any given publication. Even the lead author usually would be stumped to answer that accounting nightmare. To make the point with an extreme example – certain types of publications, for example reviews, will often, if timely and selected well, get a disproportionate amount of citations compared to all but the best of the best of primary scientific papers and while it is typical to cite your salary supporting NIH grant in the acknowledgments of a review article it is to be easily understood that these non-research manuscripts consume some time but relatively little grant monies. That said the approach works in aggregate such as in the meta-analysis about clinical vs. nonclinical research.
The metric ignores a critical counterfactual question: What is the dollar value of publications not arising from NIH funded projects? This could be examined by tracking applications turned down by the NIH that are funded by other agencies, or not funded at all, but that still result in publications. The metric would probably approach -∞ for them. How many cost-effective applications Is the NIH missing?
Very intriguing concept and analysis, however it is missing the bigger picture of NIH funded research involving communities and stake holders. In a typical RO1 of a community based research, one may not produce 2-5 publications per 5 year cycle and so the analysis as projected here is moot and is missing the consideration and the impact of changing a behavior of a patient or a community outside of the publication history.
Mike Lauer is on the right track. I think considering citations per publication per grant, or citations per grant is another good idea; those will force a PI do research that will make the most impact in the field, to move the research forward instead of sideways. Too many are churning out fluff just to make the numbers come grant renewal time. Another good idea I saw in the responses is to integrate citations in the patent databases in the impact factor determination. If the PI’s research was of substance, the publication will be used by pharma (this also will show the research was reproducible) and will be cited in their patent applications. I’d stress again that NIH needs to require PI’s to list the overall citation impact factor of their publications in their NIH biosketch. Too many tax payer dollars are being wasted on non-reproducible research and on research that will never have any practical value. Joe Biden’s Moonshot will come to nought if the current status quo continues without serious changes.
Two points:
1. Paraphrasing another commenter, once you have a test, teachers will teach to the test.
2. Different fields have different numbers of researchers. The ‘hotter’ the field the bigger, and the more citations. I’ve seen this in my own papers. If you reward citations, more and more people will flock to fields that are already well-populated.
Agreed! But, an NIH grant study section will be specific for a given area of research. Thus, they should be able to make a determination with regard to how much impact a PI’s publications have had for that particular area of research. I’d also say PIs usually flock to the Institute / Grant mechanism with the highest pay line. I have been working in the trenches of cancer research for almost 30 years (10 of these as PI), and, I’d say there are three categories of PIs. 1) Those that are really dedicated to finding a cure for cancer (or to make it a chronic condition where the patient outlives the disease) – usually these are people who have seen their loved ones suffer and die from cancer; 2) Those for whom cancer research is just a way of life – a job with security until retirement – they may have impressive CVs with hundreds of publications, continued funding, but they barely move the field forward; 3) Those for whom cancer research is just a hobby or a side project – unfortunately, I have come across a few MDs in this category – they are playing scientist – they may have the clout, the connections, money for clinical trials, but long-term they contribute little; for example 87% of clinical trial outcomes have gone unreported. These are some of the reasons why we need a major change in how federal funds are allocated, how dedicated researchers are chosen for funding etc. As Joe Biden said, in the long run, publications do not matter, what matters is the outcome for cancer patients.
amen
New applicants face their lowest level of success in the last 35 years and the NIH has presented a study showing “if we fund more scientists or more projects we increase our ability to maximize the number of great discoveries as a function of the dollars we invest.”
Great!
How about a comprehensive review of existing policy which could assist new applicants in getting fair, unbiased reviews of their work? Does the appeal process actually work as detailed under Notice Number: NOT-OD-11-064 -Appeals of NIH Initial Peer Review or has the NIH abandoned the premise of fair treatment of all applicants?
New applicants attempting to correct evidence of bias on the part of one or more peer reviewers, lack of appropriate expertise within the SRG or Factual error(s) made by one or more reviewers that could have altered the outcome of review substantially may see a success graph that looks more like this
0 ______,______,______,_______,______,_____,______,_____,______,_____,
Number of appeals for fair review
Measuring Return on Taxpayers’ Investments: Good Idea, Bad Metrics
Funding for NIH-sponsored research is concentrated disproportionately at the level of investigators, institutions and states. Jon Lorsch (“thought leader” link) points out that such concentrations of funding lead to diminishing marginal returns on taxpayers’ investments at the level of investigators. Mike’s loess plot also shows the diminishing returns for R01 grants. Such diminishing returns seem to apply at the level of whole states, too:
https://peerj.com/articles/1917/
I thus endorse Jon and Mike’s efforts to promote a more balanced distribution of funding because this would “increase our ability to maximize the number of great discoveries as a function of the dollars we invest.” I also applaud the use of total funding (rather than direct costs) as a basis for normalization because this is the only way to measure actual return on taxpayers’ investments in biomedical research.
The problem lies in the—seductive but flawed—reasoning that citation impact metrics provide an accurate measure of the value of scientific publications. If this were true, then publications of equal value scientifically would have similar citation metrics. But this is not the case. Identical scientific findings published simultaneously in different journals can have widely differing citation impacts. For examples, see:
http://onlinelibrary.wiley.com/doi/10.1002/asi.21232/full
http://journals.plos.org/plosbiology/article?id=10.1371/journal.pbio.1001675
https://peerj.com/articles/1887/
These and other studies indicate that the number of citations a paper receives is an extremely error-prone measure of scientific merit, with poor correlation observed between article quality as rated by external assessors and the number of citations the article receives.
Inferences about the “quality”, “outcome” or “impact” of NIH-funded research made using citation-based metrics should be taken skeptically. Such metrics do not provide accurate measures of productivity, and the lack of precision is of particular concern when it comes to decisions on how and where the NIH invests its scarce resources.
I know that we are all trained to quantify, but I think we are on the wrong track here. Citation numbers are strongly biased to fast moving areas of inquiry. Those of us that study chronic conditions that develop over a long period of time, or who study growth and development or other topics that require long-term follow-up, are greatly disadvantaged by short-term measures of citations. If I see an inspiring study on adult weight loss, it may be many years before I cite that study in a published paper. For example, a new finding may lead to plans to test an important new hypothesis. It might take me a year or more to obtain funding for the new study, a couple more years to recruit enough research participants, another couple of years to complete intervention and collect follow-up data, and then at least six months to complete the data analyses. and publish the results. The findings of my new study may have a huge impact in the field, but my citation for the original inspiring study will come at least five or more years later. Let’s not lose track of the fact that our most expensive health problems, such as heart disease, many cancers, COPD, diabetes, and so on, are chronic conditions that develop over decades.
Pharma skews citations and ensures that drug-related publications get far more attention than (more effective and less expensive) public health interventions. It’s difficult enough to get public Health interventions funded and published: adding this layer will in the long run ensure that more people get sick and need treatment because no one will get funded to keep people well.
Even though one might want to bracket–that is, qualify and interpret cautiously–the presumptively dependent variable of citation impact (especially when evaluating individual projects or comparing disparate fields), if one gives gives any credence to this aggregate analysis, it appears notable that the slopes of the loess regression curves for human and nonhuman studies diverge markedly at and above the dollar level of the average R01. The productivity of the nonhuman studies becomes asymptotic as dollars increase, while that of human studies saddles and then accelerates, leading the “productivity” lines to cross. This would lead one toward starkly different inferences about the merits of concentrating “extreme” sums in the upper regions, and especially the scientific merits of the expensive tails of nonhuman versus human subjects studies. The very large clinical and/or observational studies with humans seem to net commensurate citation impact; the bench projects seem not to.
I might disagree with this assessment (see the 95% confidence intervals), but quibbling about basic versus clinical research detracts from Mike Lauer’s main point: For both the human and non-human data sets, there are diminishing marginal returns in citation impact within the $1M-$10M range in which most projects fall (each slope less than 1).
However one looks at productivity (publication rate, highly cited publications, normalized citation impact), the data reveal that the current NIH practice of concentrating funding allocations disproportionately in a subset of investigators or projects is counterproductive. Moreover, Jon Lorsch’s cogent arguments (see “thought leaders” link) for optimizing the allocation of funding at the level of individual investigators apply equally well at the level of institutions and states.
Under a more egalitarian distribution of funding everybody would win—except for the minority of individuals and institutions that currently receive a disproportionate share of NIH research dollars. Kudos to Mike Lauer, Jon Lorsch, Jeremy Berg and others for taking an empirical approach to this important problem. The wheels may turn slowly, but at least they are turning.
Thank you! This is brilliant. I have been agitating for this type of analysis for many years. This is precisely the “bang for the buck” analysis that many other government programs have already been using.
I am fairly confident that smaller labs with have a higher citation per dollar quotient than massive labs where dozens of postdocs are working almost unsupervised.
There are some problems if relying on citations.
Here is one example. In cardiac field, lots of literatures related to “cardiac stem cells”, particularly c-kit+ cells, are highly cited. NIH has invested hundred of millions of dollars on these research. Recently, solid evidences from several labs have seriously challenged the claim of “c-kit cardiac stem cells” (e.g. C-kit+ cells minimally contribute cardiomyocytes to the heart. Nature. 2014; 509: 337-341). It is very likely that almost all previous papers about “c-kit cardiac stem cells” are incorrect. Did those people who published controversial c-kit work with high citations make significant contributions to science?
I think we should give enough support to sold science!
It’s interesting reading the comments. But I’m surprised at how unappreciative some people can be for what seems to be a very interesting thoughtful analysis.
Does anyone here really think that NIH and reviewers should IGNORE productivity per dollar?
Wrong metric. The measure should be improved outcomes for patients per dollar spent. Citations per dollar spent are biased by the basic science historical skewing existing at this juncture.
This is very interesting – great work! Are you able to be more descriptive; specifically are you able to make your descriptions more potantially useful by describing the determinants/associants of the citation curve. For instance, are new investigators more or less likely to publish/dollar, is having other funding for work associated with increased productivity/NIH dollar? Is being at a top 5, top 25, top 50 research institution associated with increased productivity/NIH dollar ? Are males or females more productive on average?
I absolutely agree with Elaine’s clear vision and understanding what is important and what is just a game to purely get funded irrespective of the value and the standard of science.
I have highlighted in numerous occasions doing science only and only for the benefit of science, humanity, and not for the number of publications. I can give hundreds of examples where only one or two papers repeatedly over the past 100 years in chemistry, physics, biochemistry, biology and medicine have become textbook theories, concepts that are to date irreplaceable and will never be replaced by any of the “fashion related sciences” despite all the technologies and the speed by which one could obtain so called data, which incidentally are predominantly erroneous anyway. Hence, just as everything which is classic in all walks of life one cannot supersede classics yet. Here is the proof: all of the major drugs (>> 99% that make up the doctor’s pharmacopeia) that are currently prescribed were developed between 1905 and 1970s. These include the antibiotics, general and local anesthetics, vaccines, diuretics, B-blockers/anti-angina drugs for heart, minor and major tranquilizers, pain killers and anti-inflammatory drugs, vasodilators for asthma, anticoagulants/blood thinners, and the list goes on. None of those drugs that were developed by classical approaches has been or can be replaced by any of supposedly new research or drugs that are developed in the past 30 years.
Based on the above facts, then I suggest there should be no funding by NIH and waste of taxpayer’s money based on the publication list because in reality those publications are useless today, tomorrow or ever, and often are misconceived ideas or incorrect. How does NIH or any scientist possibly justify distributing the taxpayer’s money as they do based on productivity?. Here, is an example there are more than 10, 500 papers written and published on bisphosphonates, cancer-bone metastasis/interactions, drug resistance of cancers in bone microenvironment, supported by NIH grants over the past 30 years that amount to perhaps $ 100 billion dollars. A single paper recently published by Alasmari A. et. al. (2016) Clin. & Expt Metastasis, showed paradigm-shifting conclusions that the concepts and understanding of those areas for many years were incorrect. This is yet another classic example that groundbreaking research have “no direct mathematical correlation between how many papers, number people involved or how much money is used” to provide major advancements.
An important question about all these analysis that involve particular papers credited to grants: NIH Reporter is full of papers that are credited to a grant, but published before the grant even began (or within a few months of grant starting, which doesn’t make much sense). Any plans to clean up this data? What prevents PI’s from stuffing their grant history like this?