


Introduction
Over the past 30 years of innovation and development, atomic force microscopy (AFM) has become a complicated alphabet soup of modes. There are currently dozens of acronyms that describe a myriad of AFM-based techniques for the exploration of various surface properties including topography, electrical/optical/magnetic/mechanical properties, lithography, and force spectroscopy [Reference Yablon1]. The wide variety and complexity of AFM modes can be confusing, especially to newcomers to the technology. Furthermore, many research-grade AFMs come equipped with advanced functionalities, often including capabilities that are superfluous and not useful to the user wishing to conduct a specific type of experiment.
Nanosurf’s CoreAFM is a new platform designed to provide all the power of a research-level AFM but with a “build your own” approach to application modularity. It is based on a compact single-unit design with AFM features such as a flexure-guided scanner, digital controller, air-flow protection, and low-noise force detection. The instrument has a lateral maximum scan range of 100 µm and a vertical maximum scan range of 12 µm. While suiting the needs of high-end research, this platform also addresses beginners in the field with a tiered approach to functionality in an easy-to-understand organization centered around recognizable visual icons for quick identification.
The base instrument has several core AFM modes that represent essential imaging capabilities but also serve as building blocks for advanced methods: static force, dynamic force, phase imaging, lateral force, standard spectroscopy, standard lithography, force modulation, standard magnetic force microscopy (MFM), and liquid mode. The word “standard” here refers to a level of the mode, which can be enhanced by optional additions. These modes are described in detail below. For each of these modes, self-contained kits are available that include samples and/or cantilevers for easy demonstration or training. The kits for static force, dynamic force, and phase imaging are included with the base instrument, and the others may be acquired separately. Specific advanced capabilities are built up through “options” in progressive layers, resulting in a high-performing, user-friendly, customized AFM system [2].
Figure 1 shows a graphic illustrating the modularity of the CoreAFM with its various icons and layers, and Table 1 describes the individual icons and the capabilities of the corresponding modes. The central circle (dark orange) represents the foundation for the AFM and the core modes that come with the base system, including the optional kits for these modes. The complete circle of icons around the CoreAFM is the first layer of optional functionalities (light orange) that build advanced capabilities. A second layer of functionalities partially surrounds the first layer (pale orange), allowing further capabilities. The final layer (within the gray circle on the right) shows fluidic capabilities that build upon the FluidFM® probe holder in the first layer. FluidFM® is a microfluidic control system to deliver fluids to specialized probes resulting in improved nanomanipulation capabilities and novel fluidic experiments especially in the field of single-cell biology [Reference Guillaume-Gentil3]. With the modular platform offered by the CoreAFM, arranged in concentric layers of functionality with easily identifiable icons, the user can control and fully customize the functionality of their AFM providing only the capabilities they need in an organized, user-friendly, and easy-to understand way.
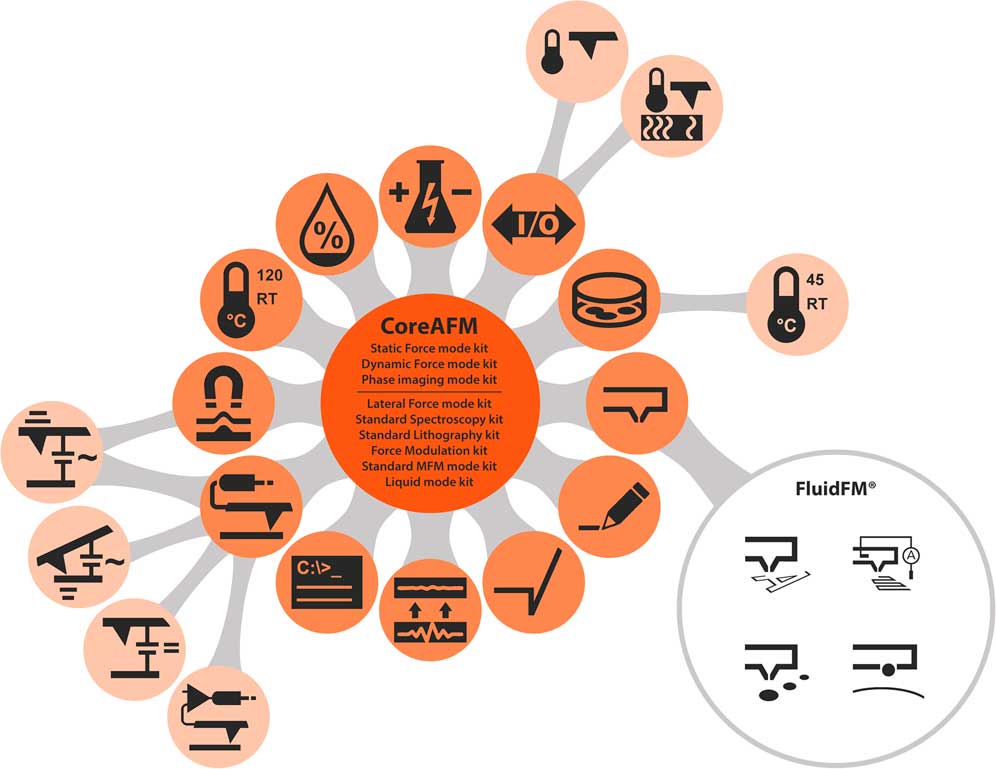
Figure 1 Diagram of the CoreAFM modular platform for total customization of an AFM. Core kits are shown in the middle (dark orange). Additional capabilities may be added: a first layer of functionality (light orange) and a second more advanced layer of functionality (pale orange). See Table 1 for identification of the modes shown here. FluidFM functionality is a third tier on the bottom right.
Table 1 Individual icons and the capabilities of the corresponding CoreAFM modes.

Core Modes
The basic CoreAFM system is contained within a case shown in Figure 2. All of the modes in the orange center circle of Figure 1 are considered “core modes.” Self-contained core mode kits are included with each instrument for the three most common imaging modes used in AFM: static force mode (contact mode imaging), dynamic force mode (tapping mode), and phase imaging mode. Static force mode and dynamic force mode are the primary AFM imaging modes where the tip is either “dragged” across the surface (static mode) or oscillated at resonance and “taps” along the surface (dynamic force). Lateral force is a corollary of static force mode where now the cantilever is “dragged” in a direction perpendicular to the cantilever axis to induce cantilever torsional motion; this mode is especially useful for imaging friction phenomena. Phase imaging is a useful channel to distinguish different materials and operates in conjunction with dynamic force, where the phase lag between the cantilever’s drive and response is monitored and displayed as the tip scans along the surface. A complete description of these modes can be found elsewhere [2].
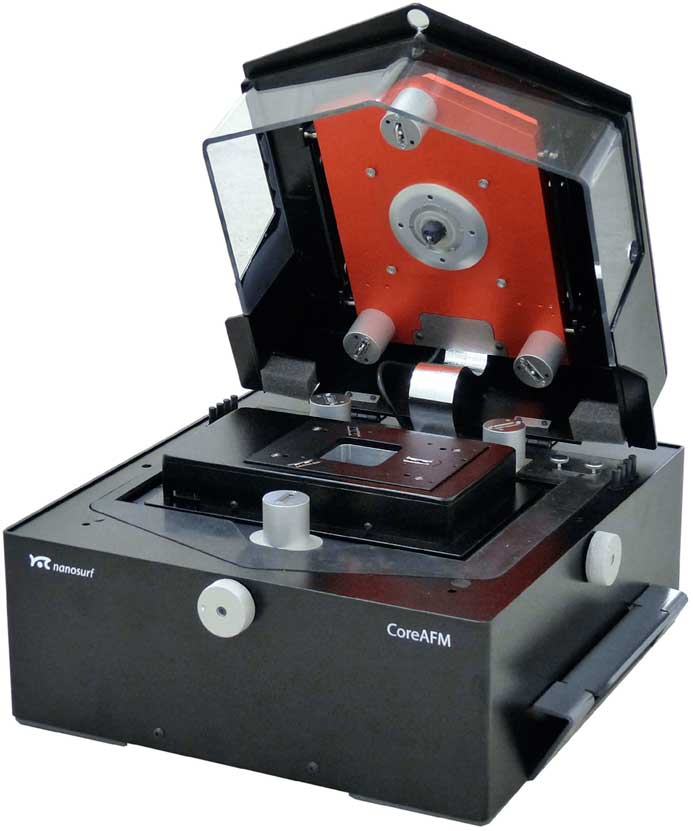
Figure 2 The CoreAFM instrument. Active vibration isolation with SpikeGuard and air-flow protection are included by default in this single system.
Other core mode kits are optional and can be added to the CoreAFM per the user’s requirements. The standard spectroscopy mode refers to single-point measurements of force versus cantilever motion as the tip approaches and then retracts from the surface at specified locations. Force modulation is a corollary of static force where the tip is still “dragged” across the surface, but it is oscillated at small amplitudes, thus resulting in small indentations into the sample and measuring the amplitude and phase shift. The final two core modes are designed for specialized samples: magnetic force microscopy scans a magnetized tip over a magnetic sample to characterize the sample’s magnetic structures, and liquid mode is designed for AFM imaging in fluid environments. [2] Figure 3 shows an example of the self-contained phase imaging mode kit that includes 3 cantilevers, a mica substrate, a solution of a blend of polystyrene and styrene-butadiene-styrene (SBS), and pipette tips for depositing the solution onto the substrate. Figure 4 shows an image set collected with the phase imaging core mode kit of a 10 μm × 10 μm region of the PS/SBS (polystyrene/styrene-butadiene-styrene) blend [Reference Schmidt4] provided in this kit. The two components of the blend are easily distinguished in both the topographic image and the phase image. In the topography image, features in white are topographically higher than features in yellow.

Figure 3 Phase imaging mode kit including appropriate cantilevers, substrate, sample, and sample preparation tools. Phase imaging is one of the core mode kits offered on all systems.

Figure 4 Dynamic mode images of a blend of polystyrene/poly(styrene-butadiene-styrene): (Left) topographic image and (right) phase image.
Figure 5 shows a CoreAFM force modulation image of a blend of styrene-butadiene-rubber (SBR) and polymethylmethacrylate (PMMA), which is the sample provided in this mode kit. The image on the left shows the topography of this sample. In the middle image is the amplitude signal clearly showing a difference between the PS and PMMA materials (orange and yellow). Aggregates appear with a third turquoise/blue contrast. In the phase signal (right), which measures dissipation, the PS and PMMA materials show some contrast between the light and dark blue, though not as clearly pronounced as in the amplitude channel.
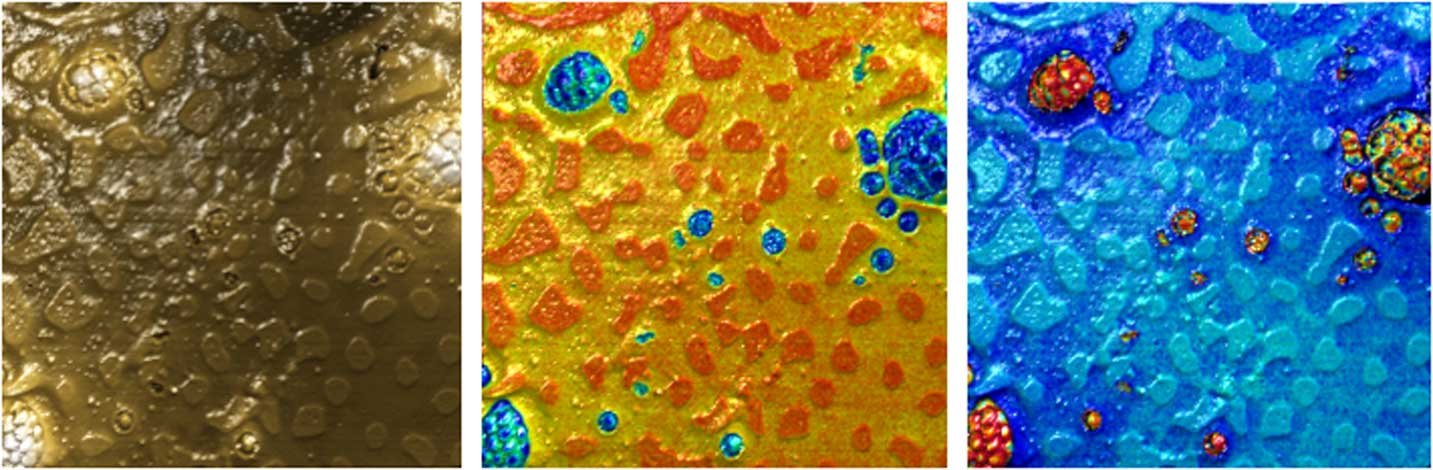
Figure 5 Force modulation images of a blend of styrene-butadiene-rubber/polymethylmethacrylate (SBR/PMMA) showing topography (left), amplitude (center), and phase (right) images.
Functionalities
Primary layer functionalities
Advanced layers of functionality can be added to the core modes through “options” that enhance specific capabilities. The primary layer of functionality (light orange icons in Figure 1 and Table 1) builds directly onto the core modes. It is useful to think of the added functionalities in terms of the categories of properties that can be characterized with AFM. Characterization of a material’s electrical properties is an important AFM measurement capability. Thus a conductive AFM (c-AFM) mode option is available for simultaneous measurements of sample topography and current flow between tip and sample. This option provides a conductive cantilever holder that offers the capability of measuring currents from 10 nA to 100 μA.
The advanced MFM option in this layer provides a capability to probe magnetic properties of the sample beyond the core MFM mode. This MFM option provides a “dual-pass contour-following” mode for more sophisticated MFM imaging. Dual-pass contour-following means that the cantilever first scans a line of topography; it is then lifted an amount prescribed by the user and traces the topography at constant separation. In this way, the topography can be deconvoluted from the magnetic interaction, improving interpretation of the data. The separation in the second scan is a user-defined parameter that can optimize the contrast in the magnetic force image. Dual-pass contour-following also improves electrical measurements such as electrostatic force microscopy (EFM) mode described below and offered in the more advanced second layer of functionality.
Environmental control of the sample is available including heating facilities, fluid cells, a petri dish sample holder, and electrochemistry cells. The sample heating option, for example, contains a sample holder and temperature controller to heat samples up to 120°C. The electrochemistry option provides a sample holder with an electrochemical cell and electrode pads to enable electrochemical AFM experiments. Another important component in this family is the cantilever holder to hold FluidFM® probes. These probes are coupled with Cytosurge technology where the FluidFM® microfluidics control system enables reliable and accurate delivery of the fluid to the probe for nanomanipulation and single-cell biology measurements [Reference Guillaume-Gentil3].
Finally, the first layer includes options for spectroscopy and lithography that build on their respective core modes. The advanced spectroscopy option includes software to perform further calibrations and enables mapping of force spectra over large areas, real-time curve analysis, and advanced control of parameters for individual force curves. It also includes software for analysis of the force curves with contact mechanics models to extract mechanical properties. The advanced lithography option builds on the standard lithography mode to allow nanolithography and nanoprinting from imported CAD vector data or bitmaps.
Secondary layer of functionality
As users customize and extend their AFM capabilities further, a second layer of functionality (pale orange icons in Figure 1 and Table 1) provides the most advanced measurements. Similar to the primary layer, the second layer can be thought of in categories of properties where environmental control, electrical measurements, and thermal measurements are important. In terms of environmental control, for example, a heating option is provided for the petri dish (from the first layer of functionality) enabling liquid heating up to 45°C.
The most significant advances in this layer are related to the electrical modes, which build upon the conductive AFM option and dual-pass contour capability from the advanced MFM functions provided in the first layer of functionality. There are a variety of AFM modes that can probe a surface’s electrical properties: (electrostatic force microscopy, EFM), surface potential (Kelvin probe force microscopy, KPFM), and electromechanical response (piezoresponse force microscopy, PFM). The EFM mode measures a surface’s electrical properties by measuring the electrostatic force between a tip and surface through the phase shift at the cantilever’s oscillation frequency. In this method, voltage is applied while the cantilever is lifted so that attractive force variations between the probe and sample induce phase shifts and thus can be monitored. As mentioned above for the case of MFM, the dual-pass approach enables deconvolution of topography from the electrostatic interaction. Additionally, the separation distance can be selected to optimize contrast based on the electrostatic forces.
Figure 6 shows the topography (left) of aluminum dots deposited onto a gold substrate, accompanied by EFM images on the right. On the top right, the EFM image was collected in constant height mode where the tip was lifted a prescribed amount over the surface and retraces the surface at that fixed height (without taking into account the surface topography). The tip voltage was +3V at the top half of the image, while on the bottom half of the image the tip voltage was –3V. The only observation in the image of this tip voltage change is the dark black line bisecting the dot. On the bottom right the same dot was imaged but now in contour-following mode where the tip lifts a prescribed amount above the surface and follows the surface topography at a fixed distance. Now the phase shift clearly detects the voltage change with the contour mode image. The reason for the phase difference is that the phase changes for metals with different work functions (like the gold and aluminum materials in this sample) with increasing voltage. At +3V, the phase on aluminum is significantly higher than that of gold. At a negative tip potential of –3V, the contrast inverts, as would be expected. The more sensitive contour mode detects this change.

Figure 6 Topography image of a grid of aluminum dots on gold sample (left) with EFM images under different conditions on the right. Schematics of constant height mode (top right) and dual-pass contour mode (bottom right). The tip voltage in the top half of the image is +3V and in the bottom half –3V. Dual-pass contour mode shows better sensitivity to tip voltage change.
The PFM option enables the built-in secondary lock-in amplifier to measure potential-induced height responses of piezo materials while imaging. To measure surface potential, the KPFM option builds on the conductive AFM mode option and can optionally include the dual-pass contour-following mode provided by the advanced MFM functionality of the first layer. Running KPFM in dual-pass contour mode provides improved interpretation through deconvolution of topography and the ability to optimize contrast in the surface potential channel. The KPFM option enables the secondary lock-in and a tip voltage feedback controller to measure the potential needed to minimize the interaction force between tip and sample, which is a measure of the contact potential difference (CPD) between tip and sample.
A thermal analysis package is available in this second layer for localized heat dissipation measurements and builds on a signal input/output capability from the first layer. In the nano-thermal analysis option, specialized cantilevers, a cantilever holder, and electronics are provided to measure the deflection of the heated cantilever as the material below the cantilever melts. In this way, the cantilever deflection can provide a localized measure of melting. In a related option, scanning thermal microscopy scans a heated probe across a surface to provide maps of local temperature and thermal conductivity.
FluidFM® functionality
This outer layer builds upon the FluidFM® cantilever holder. This technology employs the use of hollow silicon nitride cantilevers through which fluid can flow. The fluid flowing into the probes is controlled by the FluidFM® microfluidics control system. In combination with nanolithography, writing of micron-sized features becomes possible where the features are delivered through the probe as a liquid. In combination with advanced spectroscopy, FluidFM® colloidal spectroscopy can be performed with exchangeable colloidal particles aspired to the probe [5], and FluidFM® spotting can deposit spots of different volumes on the surface in the sub-femtoliter range [6].
Conclusion
CoreAFM provides a convenient and customizable platform to build an AFM with individualized capabilities in an easy-to-understand process. A layered approach provides core capabilities in options that can be progressively advanced, with primary and secondary functionalities, through the appropriate hardware and software. Mode kits that include samples, cantilevers, accessories, and tools are also available to get the user up and running with a mode as quickly as possible. This organized, easy-to-understand platform is appropriate for both newcomers to AFM technology and veterans seeking a specific set of advanced capabilities.


