Q2 2016 Negative Equity Report: Why Cities and Suburbs Are Only Sometimes Impacted Similarly
At its worst, negative equity touched all kinds of homeowners in all kinds of markets. The type of community a given home was in – urban or suburban – mattered little. Fast-forward a few years, and the relative vibrancy of a given community and how it has performed over the past few years, and not necessarily its location in the city or suburbs, matters a great deal.
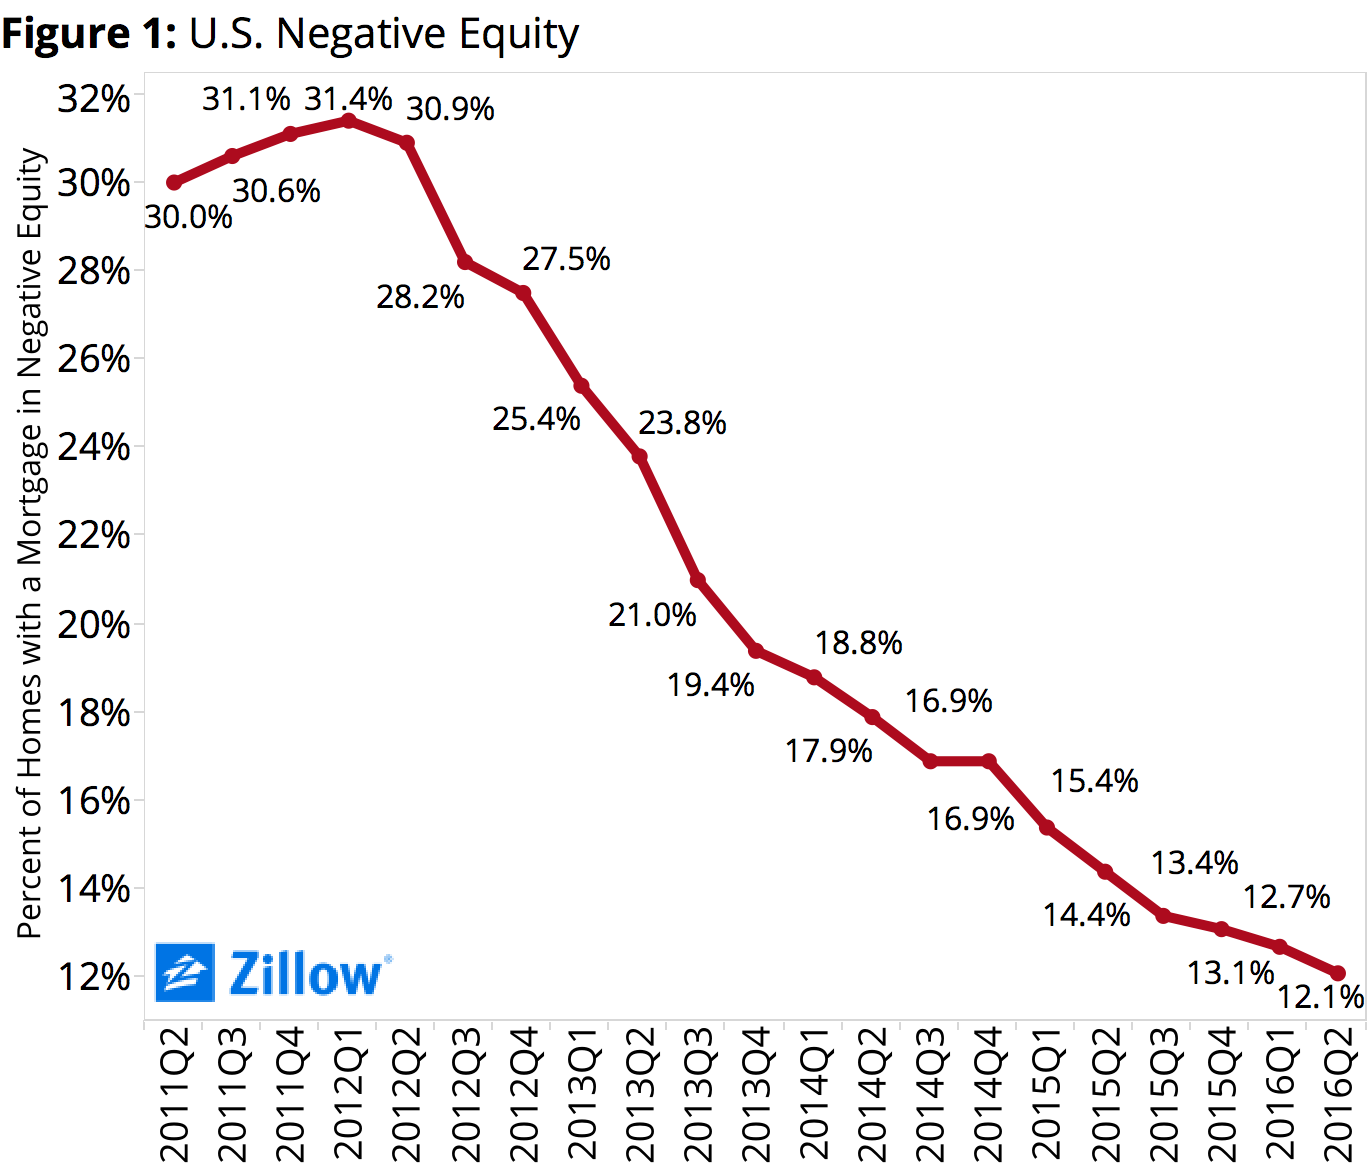
- Nationally, 12.1 percent of mortgaged homeowners are underwater, down from 12.7 percent in Q1 and 14.4 percent a year ago.
- Cleveland and Detroit have the greatest difference between urban and suburban negative equity rates.
- Negative equity is lowest in Western metros with strong job and housing markets.
At its worst, negative equity touched all kinds of homeowners in all kinds of markets. The type of community a given home was in – urban or suburban – mattered little. Fast-forward a few years, and the relative vibrancy of a given community and how it has performed over the past few years, and not necessarily its location in the city or suburbs, matters a great deal.
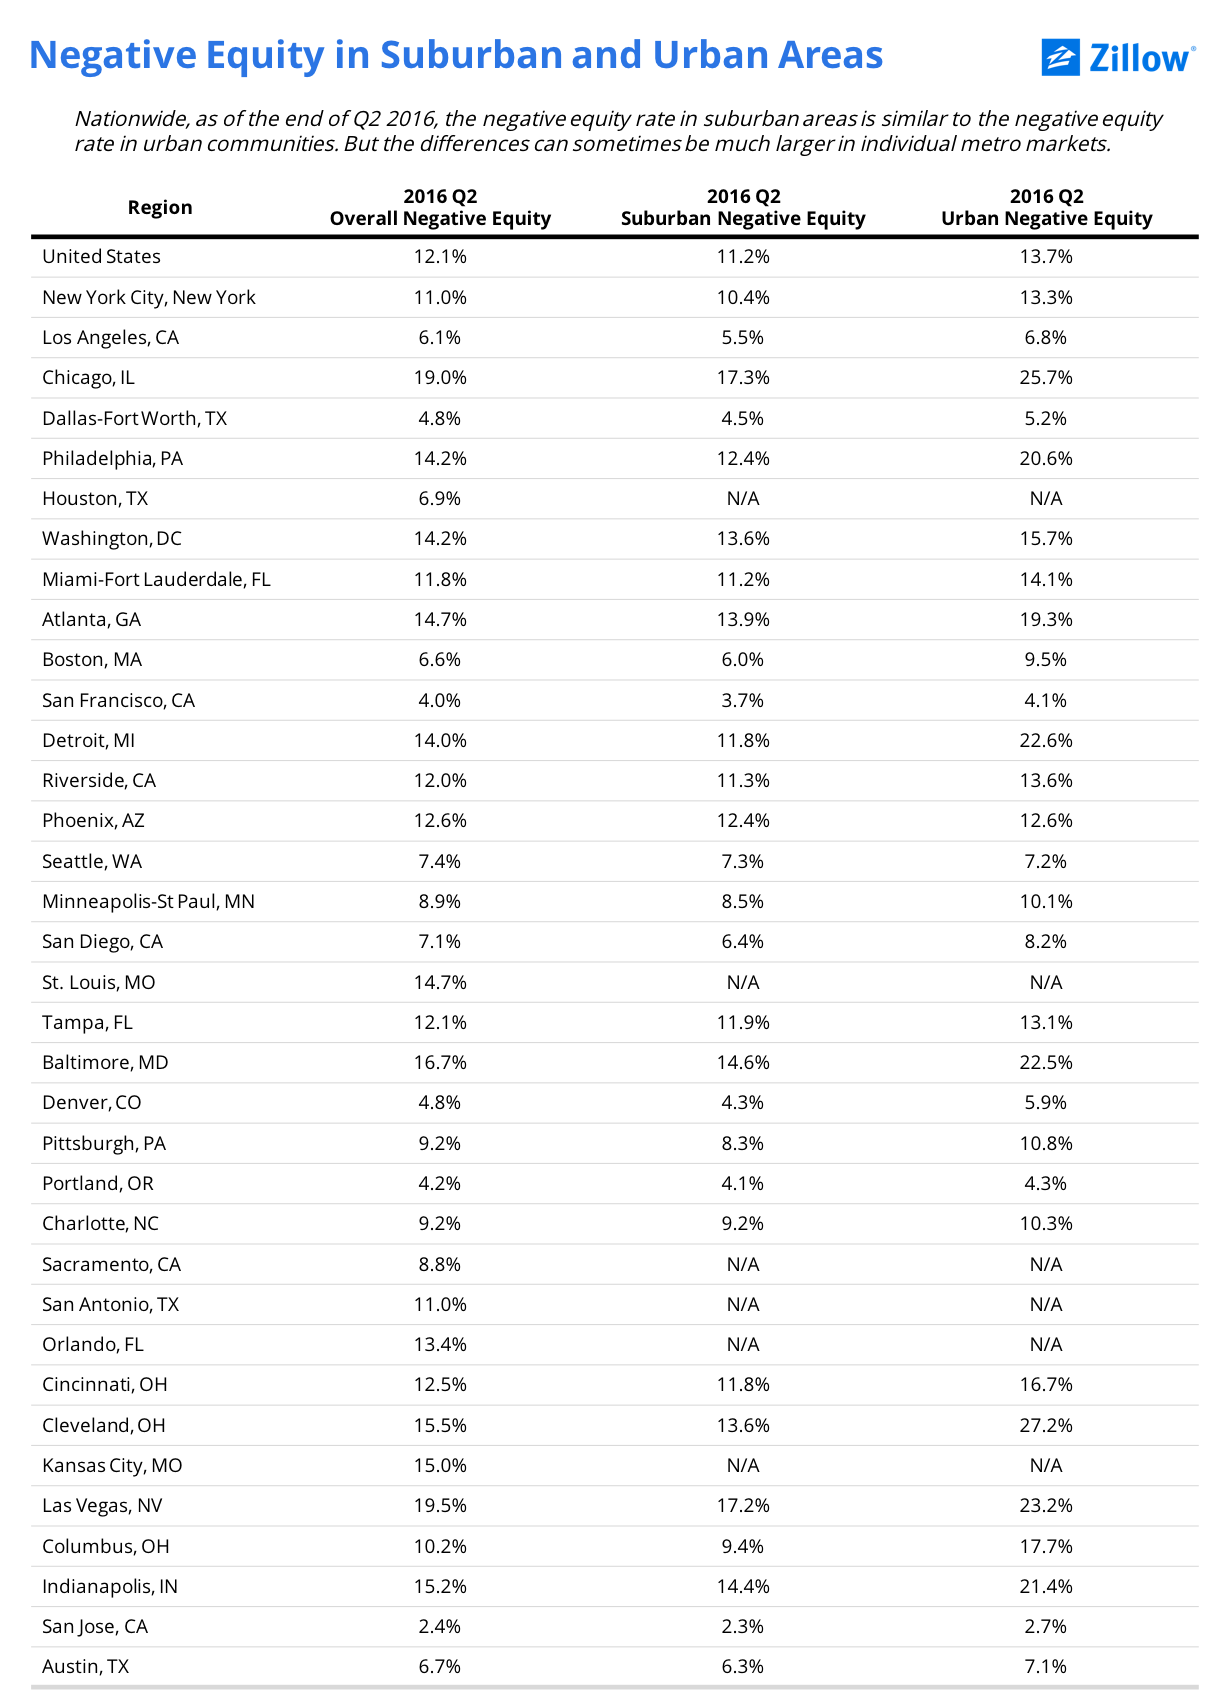
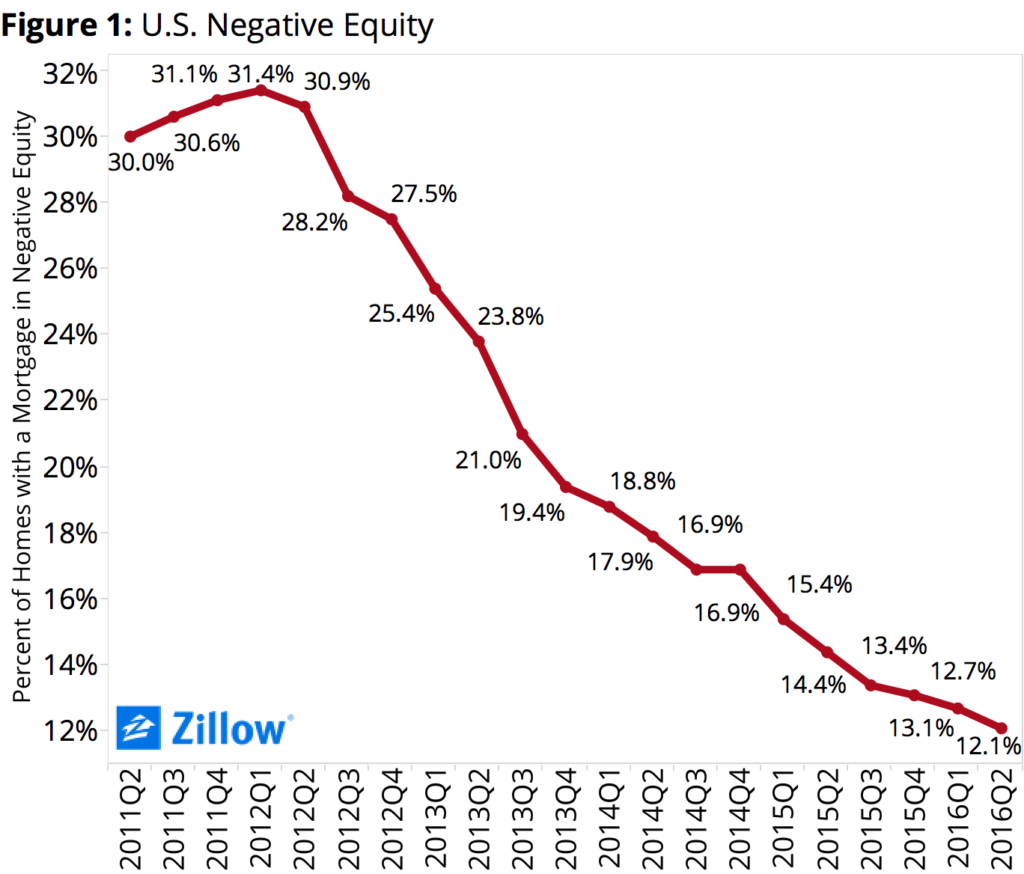 According to the Q2 Zillow Negative Equity Report, the overall U.S. negative equity rate as of the end of Q2 2016 – the share of homeowners that were underwater, owing more to their lenders than their home was worth – was 12.1 percent. That’s down from 12.7 percent in the first quarter and 14.4 percent at the same time a year ago (figure 1). When examining the negative equity rate in urban and suburban areas, we found that 13.7 percent of homeowners in urban areas and 11.2 percent of homeowners in suburban communities were underwater at the end of Q2.
This general trend of roughly comparable negative equity rates in urban and suburban regions also holds in a number of large, local markets. In 13 of the nation’s largest metros, the share of urban homeowners who are underwater is within two percentage points of the share of underwater suburban homeowners (see table). Cleveland and Detroit had the biggest difference between negative equity rates in urban and suburban neighborhoods – both have a double-digit difference between urban and suburban negative equity rates (13.6 and 10.8 percentage points, respectively). By contrast, negative equity is close to equal among urban and suburban areas in the Seattle area, where 7.2 percent of urban homeowners are underwater, compared to 7.3 percent of suburban homeowners being underwater.
 What these differences tell us is that while the actual location of a home in an urban or suburban setting may not matter much in determining if that home is underwater, the local market dynamics at play in a given metro matter enormously. The trajectories of all three markets noted above have been wildly different since the housing boom and bust (figure 2).
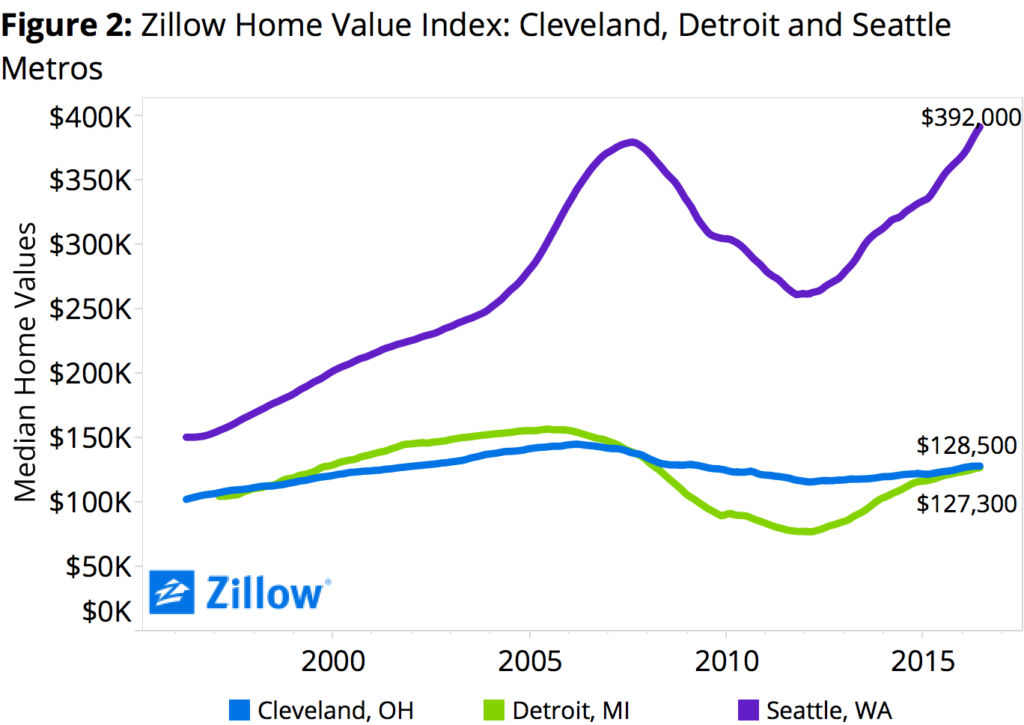 Home values in the larger Detroit and Cleveland metro areas as a whole remain below their pre-recession peaks – off by 11.6 percent in the Cleveland metro, and by 19 percent in the Detroit metro, as of the end of Q2. But those larger metros include a diverse set of urban and suburban communities, each of which is performing differently. Focusing in on just the largest urban center in each metro – the two titular cities of Cleveland and Detroit – reveals a different picture. Home values in the largely urban city of Cleveland itself are down by almost 40 percent from their early 2006 peaks. In the city of Detroit, home values are off more than 52 percent from late-2005 peaks. Both inner cities are struggling with blight and population flight.
The different performance of the cities and suburbs helps explain the wide variation in negative equity rates between the suburban areas and urban cores of these larger markets. In hard-hit areas where home values fell farther during the bust – and where they still have farther to climb before regaining those losses – negative equity is typically much higher.
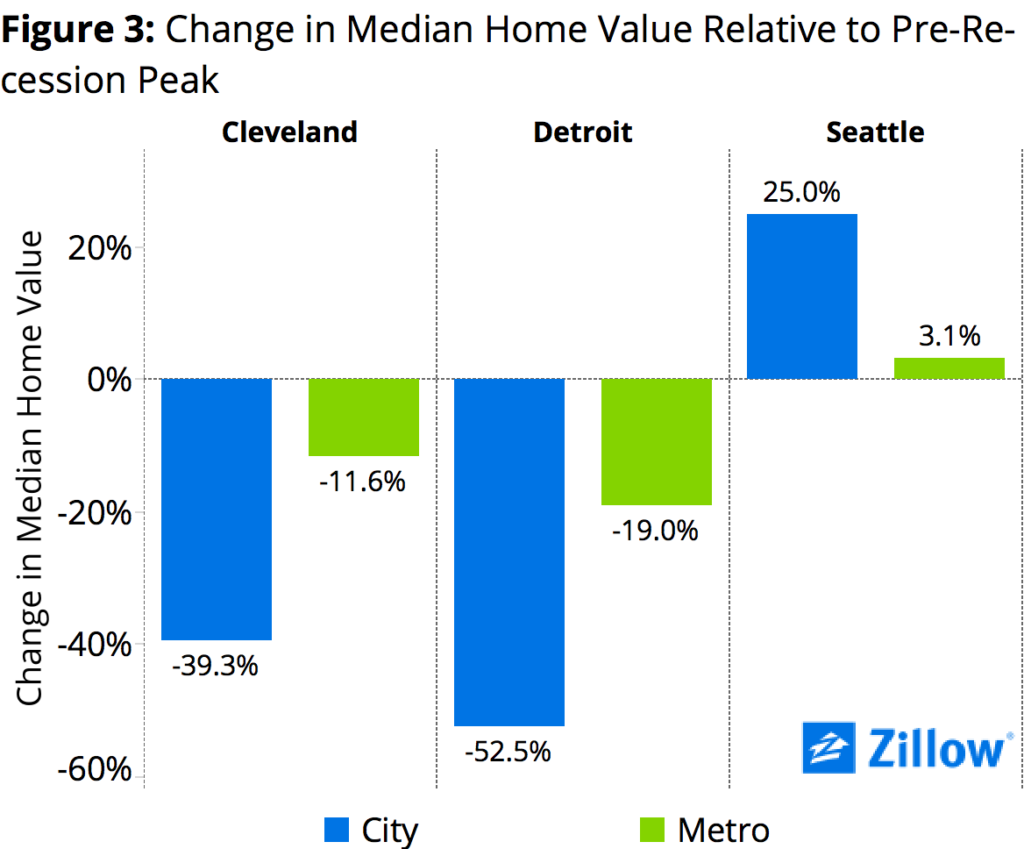 The contrast with a market like Seattle, which has been roaring in recent years as its local economy booms, is striking. Unlike the struggling Detroit and Cleveland markets, median home values in the overall Seattle metro – main cities and suburbs included – are higher than they’ve ever been, having surpassed their 2007 highs earlier this year (even as home values in some individual communities remain below peak). In the urban city of Seattle itself, home values surpassed their pre-recession peaks in early 2015 and have only climbed higher since (figure 3).
The sometimes negligible – and sometimes large – differences in negative equity rates in urban versus suburban areas within a given metro can be largely attributed to the relative performance of the metro’s namesake city. As the city of Seattle itself grows, creates more jobs and improves its overall quality of life, it attracts new residents and its success radiates out to its suburbs. In Seattle, a rising tide is helping lift all boats – urban and suburban. In Detroit and Cleveland, meanwhile, the slower-to-recover inner cities remain swamped by negative equity, even as some suburbs make better progress.
In general, negative equity is more likely to be determined by more specific factors like the kind of loan a borrower took out, how large a down payment they made and the overall performance of their local market, and not necessarily by the type of community in which that home was located. But as we’ve seen, the relative health and desirability of those communities themselves, often reflected in the performance of their local housing markets and how far they’ve come in the recovery, can play a big role.
High Pockets Persist
Despite steady improvement in the overall negative equity rate, pockets with relatively high shares of underwater homeowners remain, especially in the Midwest (figure 4). Of the 35 largest metro areas covered by Zillow, the overall negative equity rate in Q2 was highest in Las Vegas (19.5 percent), Chicago (19 percent) and Baltimore (16.7 percent). Five of the 10 largest metros with the highest rates of negative equity are in the middle of the country (Chicago, Cleveland, Indianapolis, Kansas City, St. Louis). Meanwhile, the West Coast is home to the largest three metros with the lowest levels of negative equity (San Jose, San Francisco and Portland).
Among the 35 largest markets covered, 20 had a negative equity rate lower than the national average of 12.1 percent in Q2, and 15 had a higher rate of negative equity.
Bottom-Third Blues
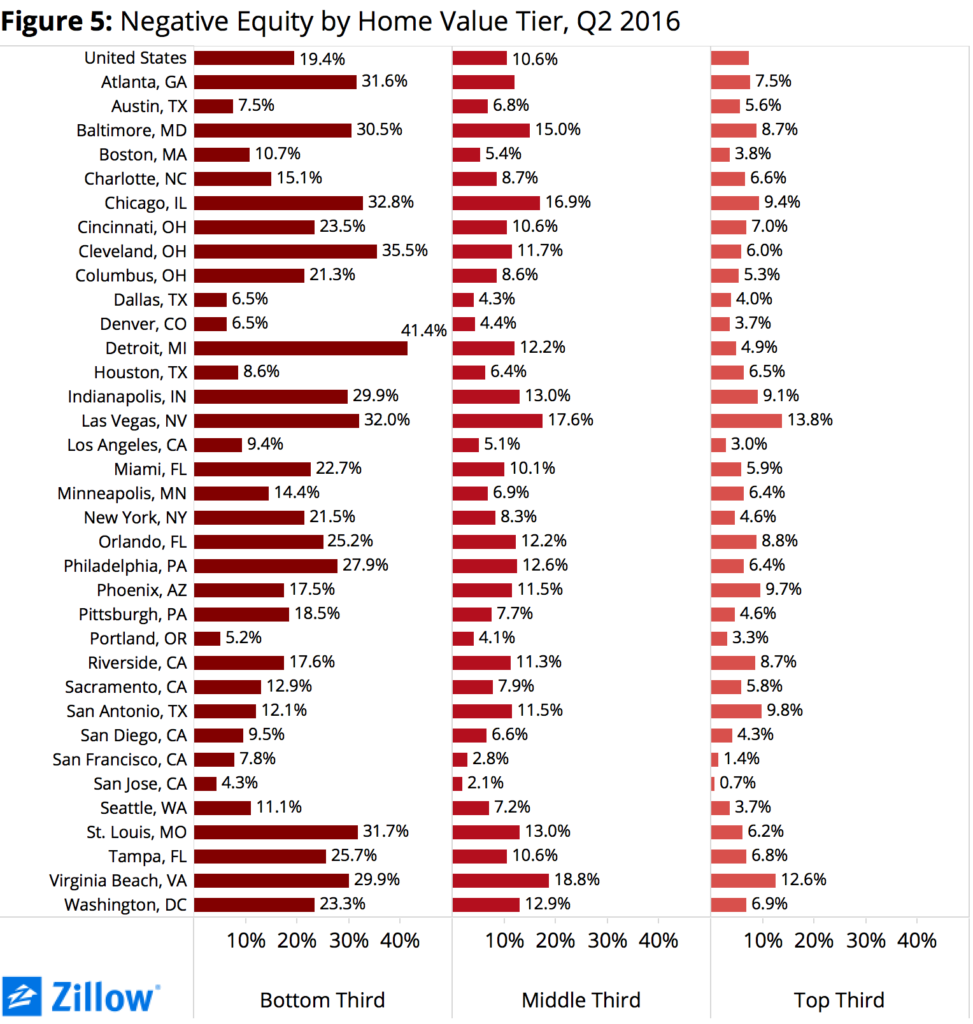
As we’ve seen, local market conditions tend to matter more than the location of markets themselves (if that market is suburban or urban) in determining how problematic negative equity is in a given area. Similarly, the relative value of a given home compared to other homes in its market can also be a good indicator of negative equity – in general, the least valuable homes are more likely to be underwater than the most valuable.
Nationwide, 19.4 percent of homes valued in the bottom one-third of all homes were underwater as of the end of Q2, compared to just 7.3 percent of homes in the top one-third (figure 5). This trend also holds true in all 35 of the largest metros analyzed by Zillow.
 Effectively Underwater
In general, if the balance on a homeowner’s mortgage exceeds the value of their home, they’re underwater. But even those homeowners with some positive equity could still be trapped in the no-man’s land of “effective” negative equity. These homeowners may have some equity in their home, but likely not enough to sell it and use the proceeds to comfortably afford the down payment and other costs associated with buying a new home and selling their old one.
Including those homeowners with less than 20 percent equity in their home, the U.S. effective negative equity rate jumps to 28.3 percent of homeowners with a mortgage (figure 6). Large metro areas with the highest effective negative equity rates include Las Vegas (40.5 percent), Baltimore (37.1 percent) and Indianapolis (36.8 percent).


