Mining
The March of the Zombie Miners Continues [Chart]
![The March of the Zombie Miners Continues [Chart]](https://www.visualcapitalist.com/wp-content/uploads/2016/04/zombie-miners-working-capital-yoy.png)
The March of the Zombie Miners Continues [Chart]
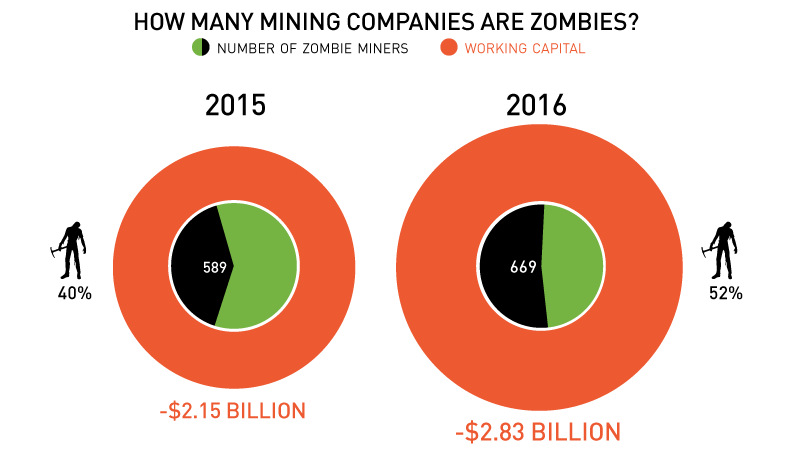
New report shows that over half (52%) of all Canadian-listed mining companies are zombies
The Chart of the Week is a weekly Visual Capitalist feature on Fridays.
Canada has a reputation worldwide as the epicenter for mining exploration, and over the years the country’s junior-listed companies have created billions of dollars in wealth through new mineral discoveries.
However, these days, Canada is home to a horror story that seems to haunt investors more each year: 52% of all Canadian mining stocks are now “zombies”, and together the walking dead combine for a total of -$2.8 billion in negative working capital.
The “Zombie” Backstory
It was just over a year ago that Tony Simon, President of Seguro Consulting, brought to our attention the initial problem of the zombie miners.
In this case, his “zombie” definition referred to mining exploration companies that had negative working capital and therefore did not meet the Continuous Listing Requirements (CLR) for the TSX and TSX-V stock exchanges.
Our chart from last year called “A Miner Problem” detailed these requirements, while also showing the ugly state of the 589 listed companies’ balance sheets. Many of these companies have negative working capital because they have no real assets that can be monetized, while being saddled with mounting costs or unsustainable debt.
Zombie Survival Tactics
Break out your Zombie Survival Kit, because we now have another year’s worth of information from Mr. Simon, who is a CPA by designation.
Here are the stats that caught our eye, most of which are also included in this week’s chart:
- The number of zombie miners increased from 589 to 669.
- Zombies now make up 52% (up from 40%) of all mining companies in Canada listed on TSX and TSX-V exchanges.
- The average zombie has had negative working capital for 44 months.
- Negative working capital of all zombie companies increased by 31.6% from -$2.15 billion (2015) to -$2.83 billion (2016).
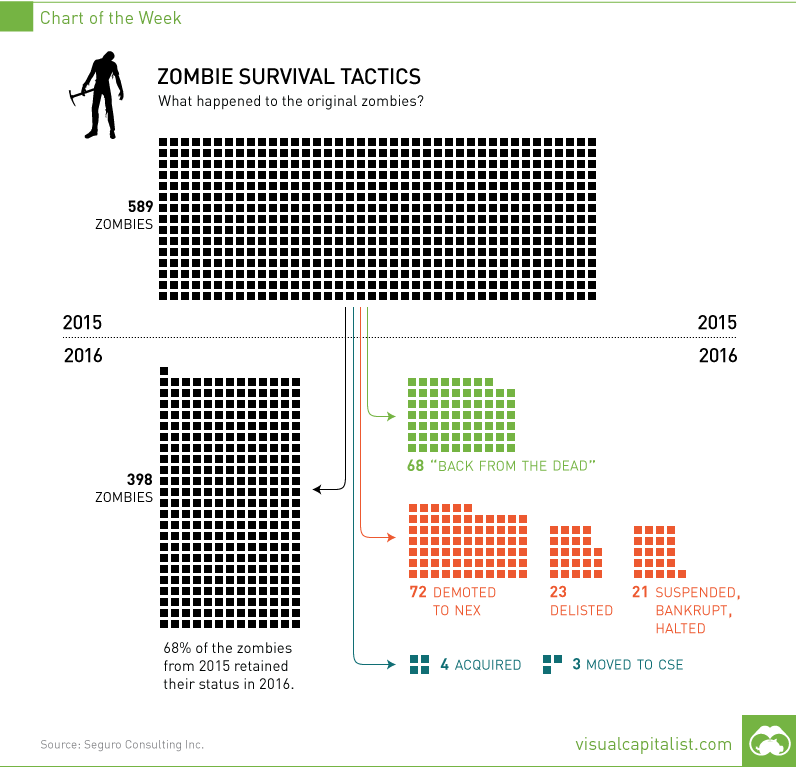
Of the original 589 zombies, 398 (68%) stayed as zombies the following year, and were counted towards 2016’s total. Mr. Simon provided us with some additional stats on the companies carried forward:
- 51% of the zombies have share prices of $0.025 or less.
- Only 13 zombies had $1,000,000 or more of liquidity in the last quarter.
- Meanwhile, an astonishing 68% of zombies traded with less than $50,000 of liquidity last quarter.
- 55% of zombies have market capitalizations of less than $1 million.
In other words, these zombies don’t eat brains for breakfast. Instead, they munch on capital from private placements until no one is willing to feed them.
So why do they continue to exist?
More Zombies, More Problems
From the perspective of the zombie management teams, it makes sense why they still roam the streets in search of capital or a stroke of luck. Just read this post by an anonymous CEO of a zombie company. To sum up: they continue to exist because of fiduciary duty to their shareholders.
However, it gets tougher to explain their existence from other angles.
How does the exchange justify keeping them around? Mr. Simon has been poking at this with a stick to try and get an answer. After all, retail investors have a tough enough time as it is, even without 52% of the total selection of companies being extreme long shots.
Here’s hoping that normalizing commodity prices in gold, silver, zinc, and other metals will help spur mergers and acquisitions in the sector. Perhaps today’s zombies can have their assets “brought to life” on the balance sheets of healthier companies.
Looking for sources?


Mining
Gold vs. S&P 500: Which Has Grown More Over Five Years?
The price of gold has set record highs in 2024, but how has this precious metal performed relative to the S&P 500?

Gold vs. S&P 500: Which Has Grown More Over Five Years?
This was originally posted on our Voronoi app. Download the app for free on Apple or Android and discover incredible data-driven charts from a variety of trusted sources.
Gold is considered a unique asset due to its enduring value, historical significance, and application in various technologies like computers, spacecraft, and communications equipment.
Commonly regarded as a “safe haven asset”, gold is something investors typically buy to protect themselves during periods of global uncertainty and economic decline.
It is for this reason that gold has performed rather strongly in recent years, and especially in 2024. Persistent inflation combined with multiple wars has driven up demand for gold, helping it set a new all-time high of over $2,400 per ounce.
To put this into perspective, we visualized the performance of gold alongside the S&P 500. See the table below for performance figures as of April 12, 2024.
| Asset/Index | 1 Yr (%) | 5 Yr (%) |
|---|---|---|
| 🏆 Gold | +16.35 | +81.65 |
| 💼 S&P 500 | +25.21 | +76.22 |
Over the five-year period, gold has climbed an impressive 81.65%, outpacing even the S&P 500.
Get Your Gold at Costco
Perhaps a sign of how high the demand for gold is becoming, wholesale giant Costco is reportedly selling up to $200 million worth of gold bars every month in the United States. The year prior, sales only amounted to $100 million per quarter.
Consumers aren’t the only ones buying gold, either. Central banks around the world have been accumulating gold in very large quantities, likely as a hedge against inflation.
According to the World Gold Council, these institutions bought 1,136 metric tons in 2022, marking the highest level since 1950. Figures for 2023 came in at 1,037 metric tons.
See More Graphics on Gold
If you’re fascinated by gold, be sure to check out more Visual Capitalist content including 200 Years of Global Gold Production, by Country or Ranked: The Largest Gold Reserves by Country.

-

 Mining2 weeks ago
Charted: The Value Gap Between the Gold Price and Gold Miners
-

 Real Estate1 week ago
Ranked: The Most Valuable Housing Markets in America
-

 Business1 week ago
Charted: Big Four Market Share by S&P 500 Audits
-

 AI1 week ago
The Stock Performance of U.S. Chipmakers So Far in 2024
-

 Misc1 week ago
Almost Every EV Stock is Down After Q1 2024
-

 Money2 weeks ago
Where Does One U.S. Tax Dollar Go?
-

 Green2 weeks ago
Ranked: Top Countries by Total Forest Loss Since 2001
-

 Real Estate2 weeks ago
Visualizing America’s Shortage of Affordable Homes