Stays in upper extreme
The USDJPY fell to the support area outlined in the post from yesterday (see: USDJPY follows dollar lower). That support came between the 200 hour MA ( green line in the chart below at 127.09 currently) and the trend line connecting most recent lows. The 200 hour MA held like a charm the price has moved higher. The price is not traded below the 200 hour moving average since February 26th.
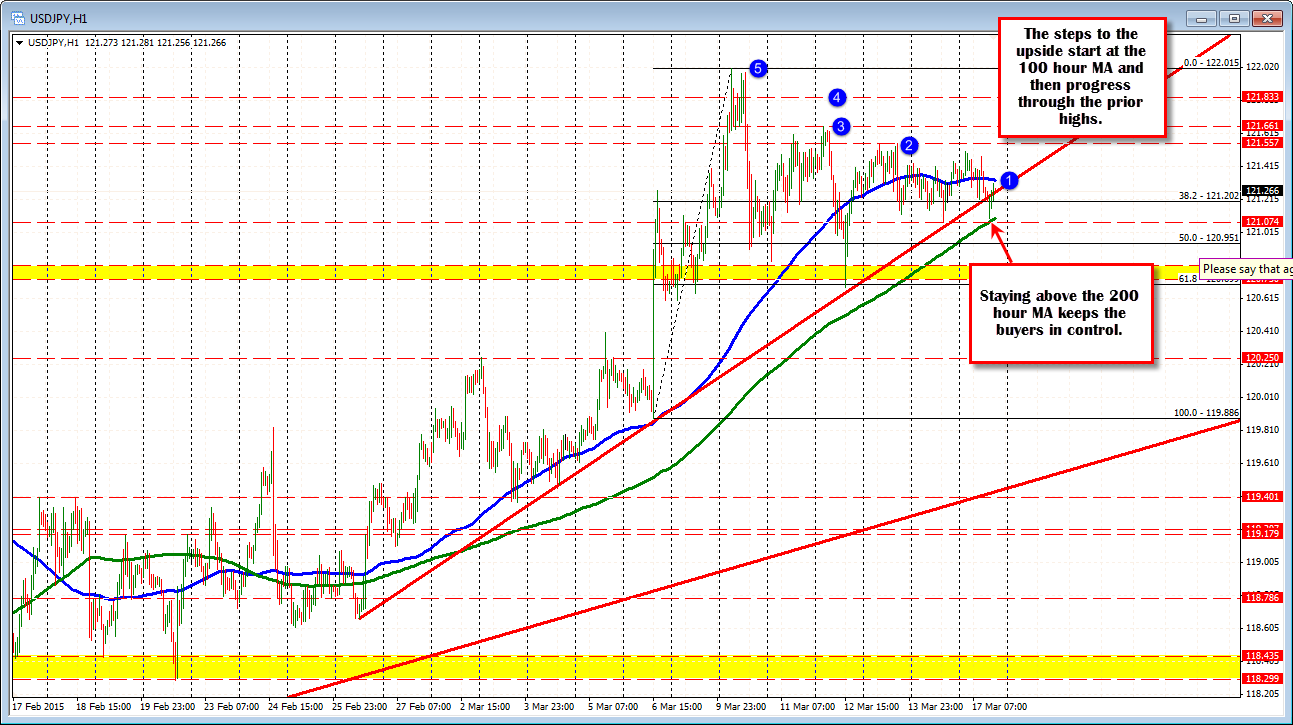
The pair is now approaching the 100 hour MA (blue line in the chart above). The price has traded above and below this borderline level, suggesting the market is not all that excited to trend higher - just yet (waiting for more direction from the Fed?). Overall, if I were to characterize the bias for the pair, it is bullish above the 200 hour MA, but not really going anywhere fast (yet)
If the buyers were to take more control, I will look for:
- a break of the 100 hour moving average to stick
- a move above the double top from last Friday's trade at 121.557. Like the 100 hour moving average. A move above that level and staying above would be indicative of a market that is more open to upside momentum
- a move above the highs from Thursday at 121.66
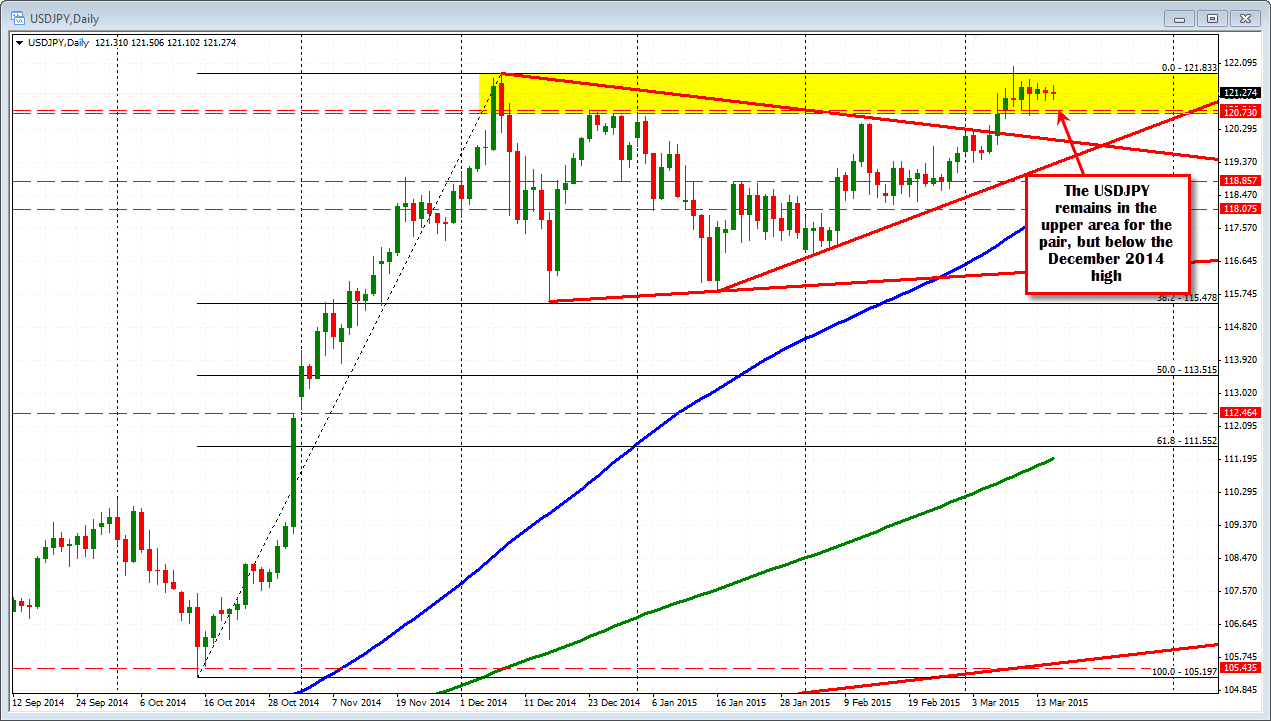
- a move above the high price going back to December 8 at 121.833 (see daily chart below)
- finally a break of the high for the year at 122.015
A break of the 200 hour MA will open the downside to further downside corrective pressure. Looking at the daily chart below a move below the 120.73-83 high prices from December should open the downside for further momentum. The underside of the broken trend line on the daily chart comes in around 120.00 - a nice round level to define support.