
Due to being head down in his studies (or a pot noodle) and work Luke’s second and third posts will be today and Friday.
A very good post on Monday is followed by an equally good post today
Within this post I’m going to take a look at the GBP/USD, with the Bank of England taking center stage tomorrow.
Last month when the Monetary Policy Committee met a unanimous decision to keep rates on hold was reached. Two hawks that have previously dissented to keeping rates on hold Ian McCafferty and Martin Weale, changed their stance. Voting to keep rates on hold this time around, I’m intrigued to see what the outcome of today brings but I can’t see any change occurring. However as we have all seen of late central banks have taken us by surprise so it’s always good to be prepared. Falling inflation seems to be big problem within the economy at the moment falling to 0.5% in December substantially below the government 2 per cent target inflation rate. This scenario takes the pressure off The Bank of England to raise rates anytime soon. A rate hike in the current environment could be damaging.
Anyway back to the charts and what I’m looking at.
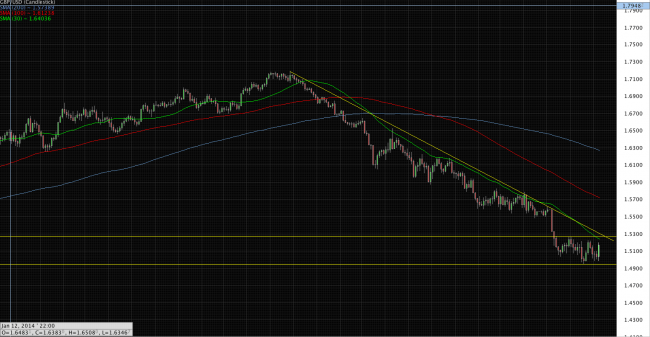
GBP/USD Daily chart
Looking at the daily chart (Figure 1) we can see the bear market this pair has found itself in. The Pound is one beaten up currency at the moment. I myself never thought id see her Majesty’s currency back down at this rate, most certainly not after Mr. Carney’s speech at Mansion House. But with money trying to second guess who’s going to hike first and with the Federal Reserve winning that race at the moment it seems logical that we now find ourselves here.
The overall low of this move down comes in at 1.4951 on my charts recorded on Thursday 22nd January. Since that low we have tried to get back down there on two occasions on Thursdays 29th and today the 3rd February both times falling short at 1.4989. Could this be a short-term bottom? I have extended a trend line from the high recorded in the summer July 15th 2014 at 1.7175 which now comes in at 1.5262.
The figure of 1.5266 capping the price on January the 14th and 15th setting it up for the move to touch the overall low of this move down. Just below this cluster of resistance we have the 30-Day Moving Average, which comes in at around 1.5233. This Area in my view is going to be a tough nut to crack as seller will be waiting at this level shown with the fact we have not be able to break above the 30 Day Moving Average for a long time period.
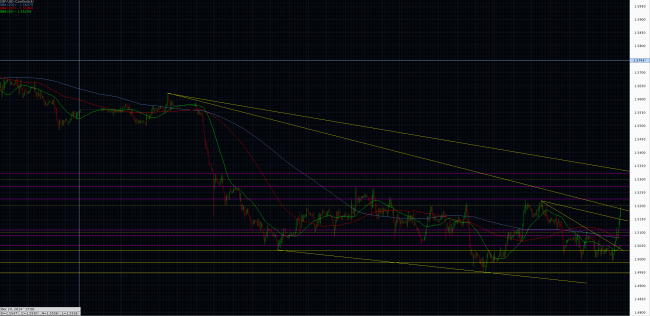
GBP/USD Hourly chart
I shall refer to the purple lines, which I have outlined as P1, P2 etc, the most bottom purple line being P1 and following numerically up the chart. These purple lines are former resistance and resistance lines. I like to use resistance lines that have been broken through as turned supports, for this pair when using a trailing stop or just overall risk management. We fell through P1 in Monday’s American session P1 comes in at 1.5050 it held throughout the rest of the session and the Asian session too with the 30 hour moving average just below it protecting it. We however broke through the 30 hour moving average and P1 during early morning European session and held this level since then we have rallied reaching a day high of 1.5198. Within my hourly chart this move has broken through some significant areas were I expected some strong resistance, which highlights to me how bid the pound was today. Breaking through the bottom trend line that I have extended off the high on Wednesday 28th Jan at 1.5218 which too came in at the 1.5050 area I’m currently long from this position and have taken some of the money off the table due to tomorrows events but will be looking at how things play out to put money back into this pair. P2 represents 1.5085 this area has capped the pair since breaking through it on the 29th January. Sellers stepped in at this price over the last few days and moved price back down. In this area we had the 100-hour moving average 1.5083 And 200 hour moving average 1.5080. When price broke through this area it spiked hitting 1.5119 sellers tried and failed to push price back below the two moving averages giving the green light for further gains throughout the American session.
I have extended a top Trend line from the high on Wednesday 28th Jan at 1.5218 which comes in at 1.5149. This area I expected a bigger fight than was put up and was where I subsequently trimmed my position. I’m looking at this area of 1.5149 and the 1.5110 area to be an area where buyers protect to keep momentum in the bulls camp.
If the bulls can keep the momentum going I expect resistance to come in at P4, which is the high of the move down coming in at 1.5222 set on Tuesday 27th January. Above this at P5 I see my next resistance coming in at around 1.5268 above that shown with P6 we have resistance coming in at 1.5335 along way off I know but still nice to know its there. P6 capped price, which prevailed into a downward move to 1.5030 so I’m sure some bids can be found there if we get there.
I will be keeping a close eye on what comes out of the Monetary policy Committee meeting tomorrow for any change in language, or outlook. My trade set up with this pair is Long at 1.5050 with a tight stop stuck below 1.50 Handle my first target being the 30 Day moving average at 1.5233 with my second target upon a close above the 30 Day moving average coming in at 1.5335 in the hourly chart. My positions when aiming for the second target of mine will be reduced, due to it being a long-term trade I don’t want to be overly exposed and subsequently burnt. I shall however add and trim around this main position as I see what plays out In front of me. I know my second target will have to work through a lot of sellers lurking out there, which is why I will adjust my stops and positions accordingly when going for it. I like this trade set up from both a macro and technical level.
I’m Interested to see how other people within the Forexlive community view this pair so will be keeping a close eye on the comments thread.
Thanks Lproject92 Luke Mumford

