
If you are scanning for candlestick patterns you will find hundreds every day. The key is to find ones that can make you money. In this article I will cover 4 of the best patterns to scan for and explain their characteristics.
According to the great statistics provided by Thomas Bulkowski there are 4 candlestick patterns that seem to stand head and shoulders above the rest in terms of accuracy. Here’s the best ones to scan for and watch.
3 Line Strike Candlestick Pattern
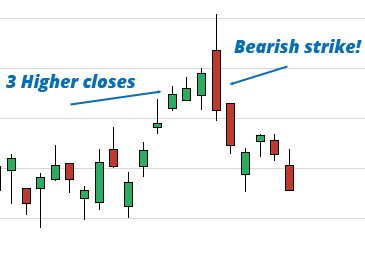
The 3 Line Strike pattern is rarely found. However, it has a very high accuracy rating and should not be ignored if you get an alert or your scan produces one on a stock. The pattern can be for bearish and bullish reversal and the ones which are most effective appear close to a yearly high or low.
For a bearish 3 Line Strike you would see 3 consecutive higher closes, followed by a bearish candle that cuts past the whole previous 3 day range. See example below.
For a bullish 3 Line Strike pattern, you would see 3 consecutive down closes followed by a bullish candle that shoots past the previous 3 day range. It’s the same as above, but in reverse.
3 Black Crows Candlestick Pattern
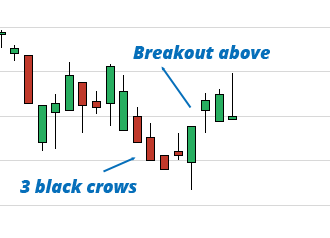
According to the stats at Thomas Bulkowski’s site, this has a hit rate of 78% at bearish reversals. However it is also noted that a breakout of this pattern area can be a strong continuation signal for a trend resuming. So discretion is needed on this one, and is worth further analysis.
The 3 Black Crows is identified by 3 long bearish candles which all close near the low of the period. If they occur near a yearly low, and the pattern is broken to the upside in future, they can signal strong reversals.
Evening Star Candlestick Pattern
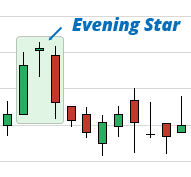
The evening star once again has a high success rate. It is best found somewhere near a yearly low and used as a bullish reversal if broken. The first candle must be a long body candle, and the “star” is a short body candle with a wick above and below. It is similar to a doji in appearance.
Abandoned Baby Candlestick Pattern
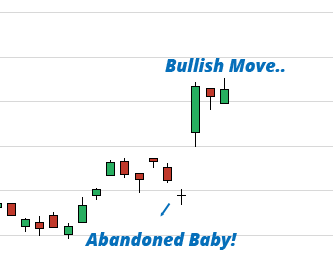
The abandoned baby has a high strike rate as a bullish chart pattern. It is a small doji candle that is left “abandoned” on its own after a sharp down move. There will be a decent down day, followed by a gap down but price goes nowhere and create a small Doji candlestick. This is then left abandoned as price gaps up and away the next day.
All these patterns are available as pre-set scans in our filter at StockMonitor.com. If you don’t have time to scan for these chart patterns each night, you can set alerts to get emails after market close, when one is detected. With the accuracy rate of these patterns, it’s worth setting up an alert!