Cause evidently I have nothing better to do, I answered my own question.
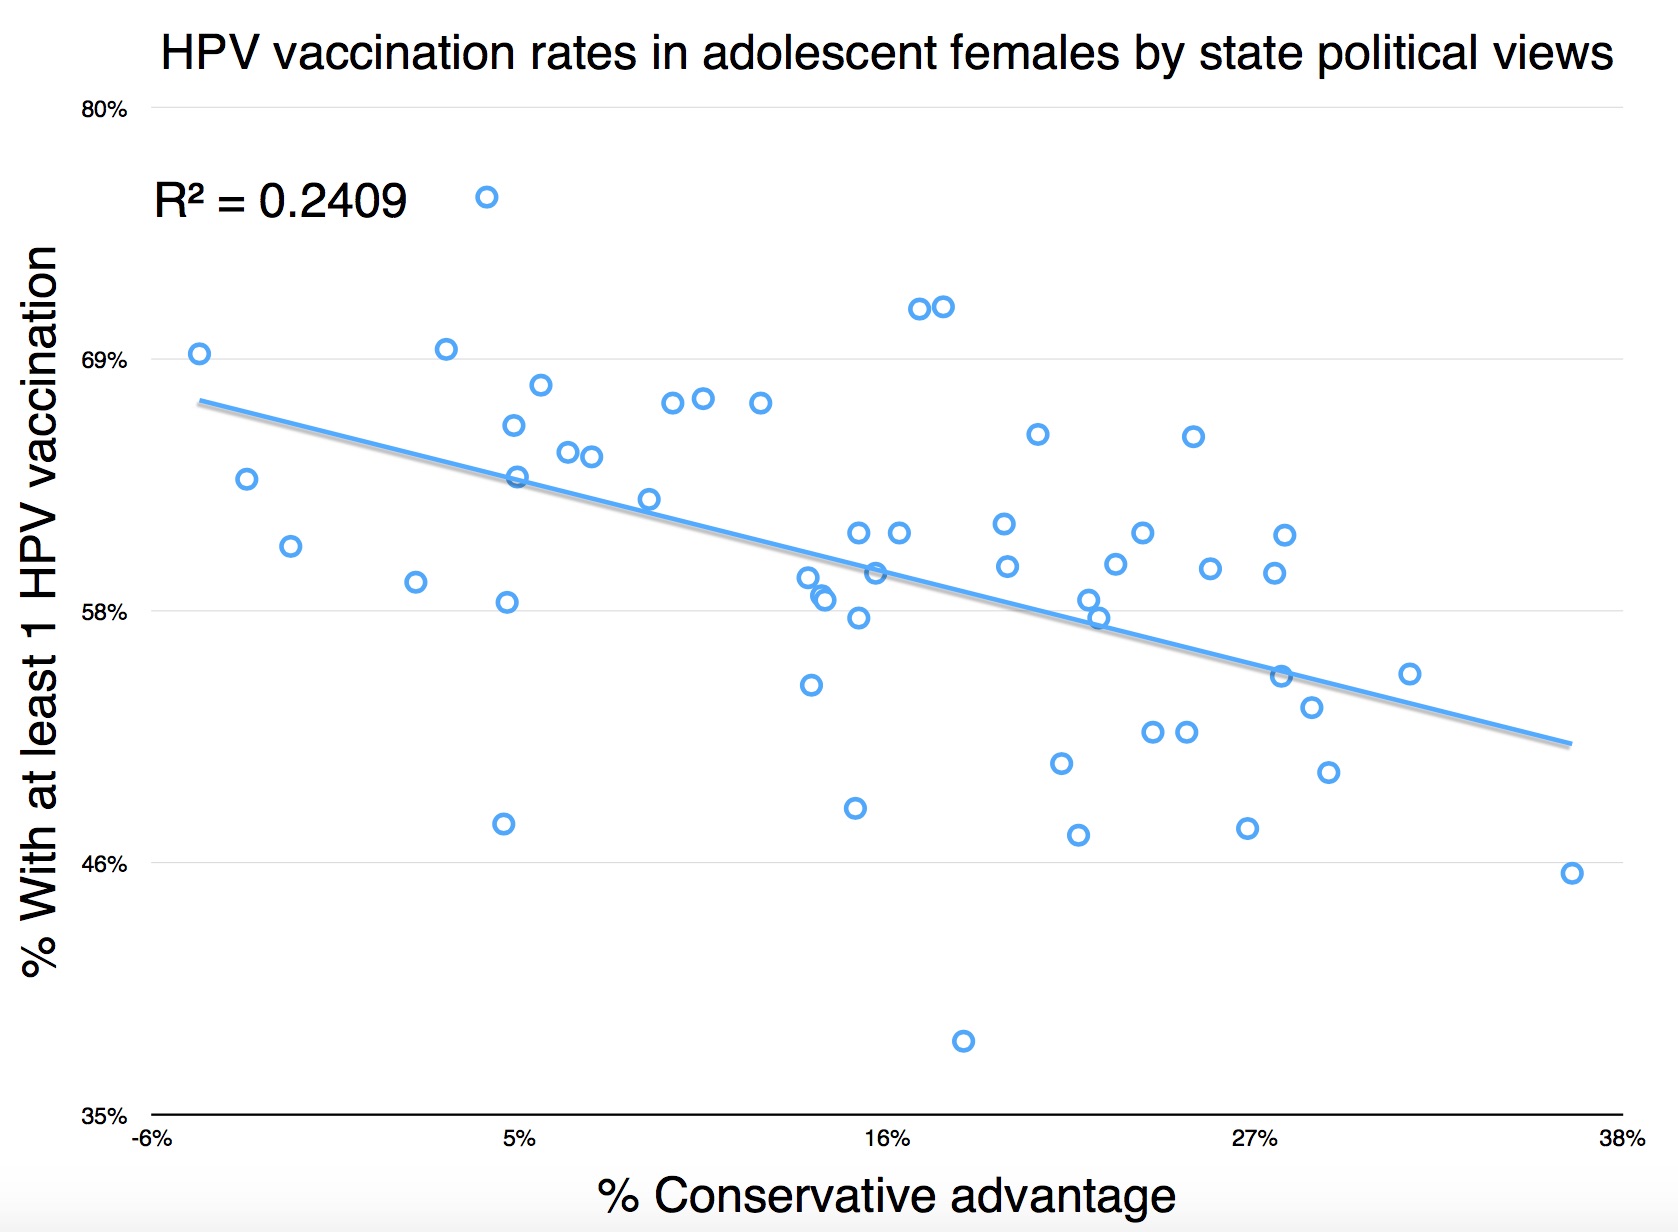
Here’s a chart I made of HPV vaccination rates in adolescent females by state political views. The Y-axis is the percentage of adolescent girls who have had at least one dose of the HPV vaccine. The X-axis is the state’s conservative advantage, defined by Gallup as, “The difference between the percentage of state residents describing their political views as conservative and the percentage describing their political views as liberal”. I added a linear trendline, and the R2.