Sentinel system pictures Napa quake
- Published
- comments

Europe's new multi-billion-euro Sentinel programme has returned its first earthquake analysis.
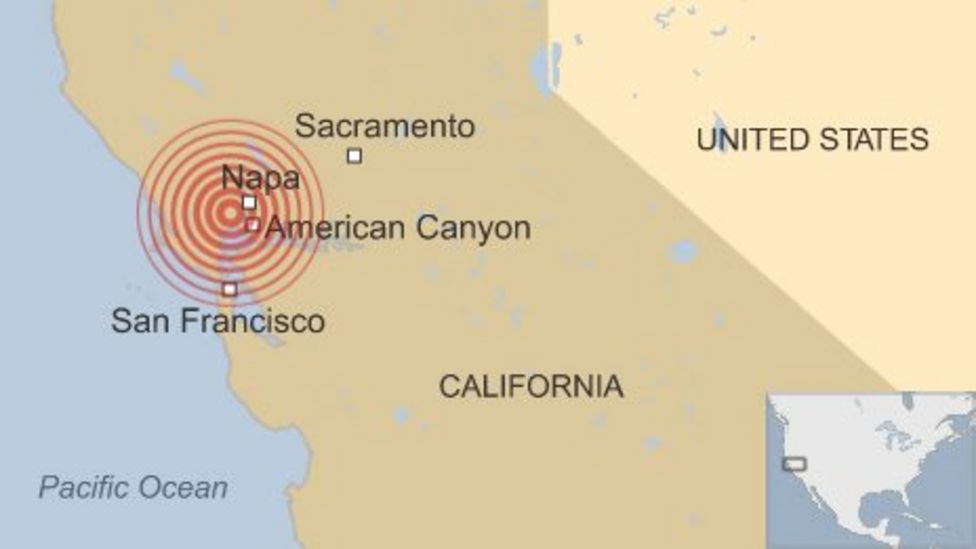
The EU satellite system has pictured how the Earth moved when the Magnitude 6.0 tremor hit California's wine-producing Napa region last month.
Scientists will use the figure, called an interferogram, to trace precisely the extent of the fault rupture.
In the past, this type of analysis has been very time-consuming, but the Sentinel project will now automate it.
Interferograms that once took many weeks, even months, to produce should in future come out within days of a big quake.
"The infrastructure is in place and once we get to work with the quality of the data now coming through from Sentinel, we should be able to start turning out these inteferograms very quickly," said Dr John Elliot from the UK's NERC Centre for the Observation and Modelling of Earthquakes, Volcanoes and Tectonics (COMET).
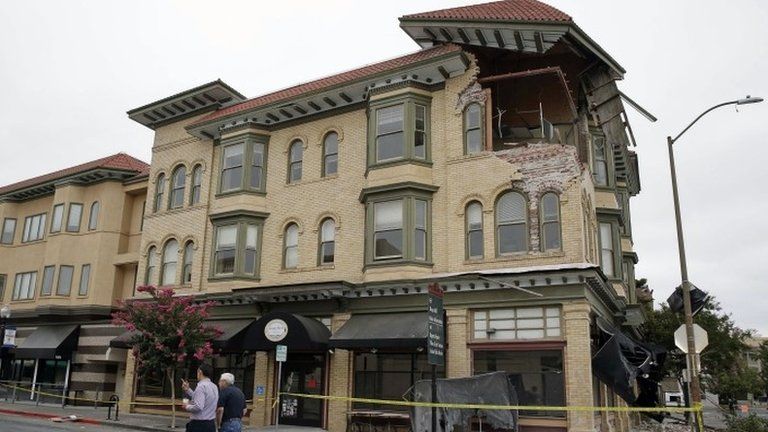
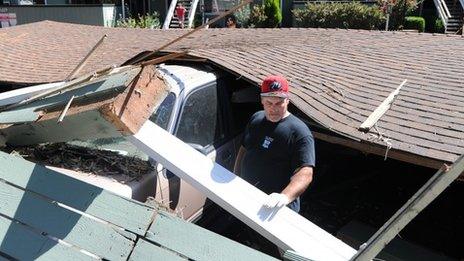
The 24 August event is the biggest tremor to hit the San Francisco Bay Area since the 1989 M6.9 Loma Prieta quake, and resulted in significant property damage, although mercifully few injuries.

The tremor occurred on the so-called West Napa Fault, which is part of a broad zone in the Bay region that carries the relative motion on the North American and Pacific tectonic plates.
These vast slabs of the Earth's crust are grinding past each other at a rate of about 4cm a year.
Researchers have been walking across Napa in recent days to try to record exactly where the deep rupture broke through to the surface.
In places, this is very evident from buckled roads and fractured kerbstones. It is important information for understanding future seismic hazards and guiding infrastructure planning.
But there are significant segments of the fault failure that have no obvious surface expression, and for these portions scientists hope to gain useful insights from the new Sentinel interferogram.
The technique that produces this type of analysis is known as Synthetic Aperture Radar Interferometry (InSAR).

It works by finding the difference in "before" and "after" radar pictures of the Earth taken from space.
This allows even quite subtle ground movement to be detected, including in those areas where the surface itself has not been ripped apart.
The Sentinel-1a radar satellite was launched in April with a specific mission objective to do InSAR studies.
Fortuitously, it got into its final operational orbit on 7 August and acquired on that very day a baseline "before" image of California, knowing that the US state would be an area of high interest.
What no-one could have predicted was that the biggest quake to hit the San Francisco Bay region in 25 years would occur just two-and-a-half weeks later.
Sentinel-1a then flew over California again this past weekend to grab the "after" radar picture.
"The satellite looks largely down, but also off to the side slightly, and this allows us to see lateral/horizontal motion - and in this type of earthquake, called a strike-slip, we see this effect as movement of the ground towards and away from the fault.
"The interferogram confirms the ground deformation is centred around the town of Napa. The fault has come to the surface but has only offset the ground by tens of centimetres, which is consistent with what the field geologists are finding," added Dr Elliott.

Interpreting the Sentinel interferogram on this page
- The surface fault rupture, mapped in the field by scientists from the University of California, Davis, is shown by the white line
- Contours of motion are denoted by coloured "fringes" that go from blue through yellow, to red, and then back to blue
- Each contour interval shows a ground motion of 2.8cm with respect to the Sentinel-1a spacecraft in orbit above the planet
- To get the total motion, you count the fringes and then multiply by 2.8 (2.8cm is half the wavelength of the radar satellite)
- The bottom right lobe, southeast of Napa, has about three fringes, and thus a total of 10cm of motion towards the overflying Sentinel
- The fringes north of Napa also show 10cm of motion, but this time away from the satellite, as the colours cycle in the other direction
Since the InSAR technique's inception in the 1990s, just over 100 quakes have been studied in this way.
But Sentinel-1a, and its soon to launch sister platform, Sentinel-1b, should transform matters.
Not only will their orbits be very finely tuned to maximise the quality of their data, but the acquisition of images specifically for quake research will now become systematic and routine.
"And because the information is open and free, we can feed it straight into UK computers," said Dr Elliott.
Although a sizeable event that produced considerable shaking, the Napa quake was 22 times less energetic than Loma Prieta.
The 1989 tremor's epicentre was 100km to the south of San Francisco, but, even so, managed to break the iconic Bay Bridge.
The quake also killed 42 people on Oakland's Cypress Street Freeway when the upper tier on the double-decked viaduct collapsed, sandwiching cars and their occupants.
Since 1989, billions of dollars have been spent retrofitting major roads and public utilities.
The most recent assessment of quake probabilities suggests that the San Francisco Bay Area has a two-in-three chance of experiencing a M6.7 event or larger in the next 30 years.

The Sentinel-1a spacecraft is the first in what will be a fleet of EU satellites dedicated to studying the changing Earth. Five further missions with different types of sensors should be in orbit by 2019.
European nations have so far committed 7.5bn euros (£5.9bn; $9.8bn) to the project.
But the vision for the Sentinel programme is that it is unending - that every satellite/sensor is replaced at the demise of its mission, ensuring there is continuity of information deep into this century.
The interferogram on this page was produced by COMET's partners - the Norut research institute in Tromso, Norway; and PPO.labs in The Hague, Netherlands.

- Published25 August 2014
- Published16 April 2014
- Published25 August 2014
- Published5 December 2012
- Published20 October 2008
- Published16 April 2006


