The Mortgage Bankers Association (MBA) today released its Weekly Mortgage Applications Survey for the week ending May 28, 2010.
"With another week of historically low mortgage rates, the trend from the prior three weeks continued, as refinance applications increased while purchase applications dropped. Purchase applications are now almost 40 percent below their level four weeks ago, while the refinance share, at 74 percent, is at its highest level since December," said Michael Fratantoni, MBA's Vice President of Research and Economics. "In addition, the ARM share dropped last week to its lowest level since March of this year, as borrowers took the opportunity to lock in at historically low fixed mortgage rates."
The Mortgage Bankers Association application survey covers over 50% of all US residential mortgage loan applications taken by mortgage bankers, commercial banks, and thrifts. The data gives economists a look into consumer demand for mortgage loans. In a low mortgage rate environment, a trend of increasing refinance applications implies consumers are seeking out a lower monthly payment which can increase disposable income and consumer spending (or give consumers a chance to pay down other debts like credit cards). A falling trend of purchase applications indicates a decline in home buying interest, a negative for the housing industry and the economy as a whole.
Excerpts Taken From The Release...
The Market Composite Index, a measure of mortgage loan application volume, increased 0.9 percent on a seasonally adjusted basis from one week earlier. On an unadjusted basis, the Index increased 0.3 percent compared with the previous week. The four week moving average for the seasonally adjusted Market Index is up 3.5 percent.
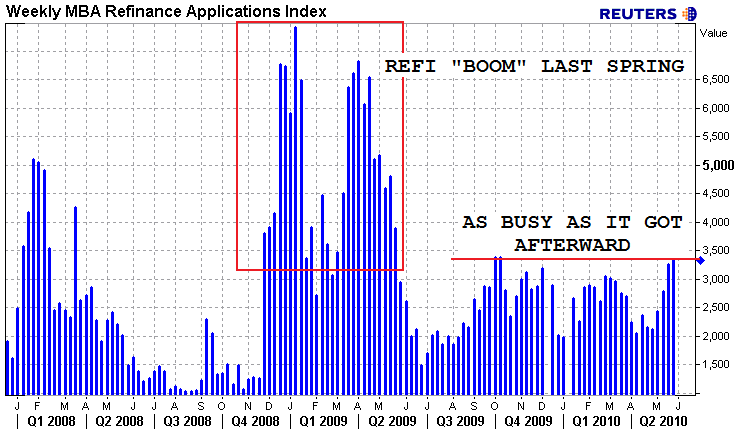
The Refinance Index increased 2.4 percent from the previous week. This was a smaller increase than in previous weeks, but was still the fourth consecutive weekly increase for the Refinance Index and it remains at its highest level since October 2009. The four week moving average is up 11.5 percent for the Refinance Index. The refinance share of mortgage activity increased to 73.8 percent of total applications from 72.2 percent the previous week.
The seasonally adjusted Purchase Index decreased 4.1 percent from one week earlier. The Purchase Index decreased for the fourth consecutive week and is currently at the lowest level since April 1997. The unadjusted Purchase Index decreased 5.2 percent compared with the previous week and was 16.8 percent lower than the same week one year ago. The four week moving average is down 12.1 percent for the seasonally adjusted Purchase Index.
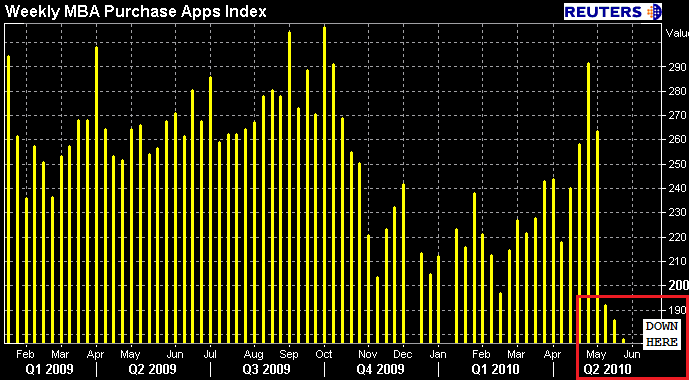
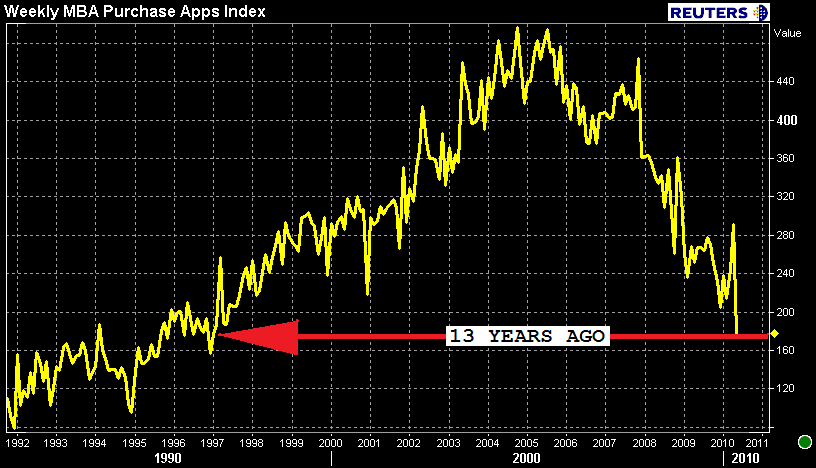
That chart doesn't really put things in the proper perspective, but this one does...
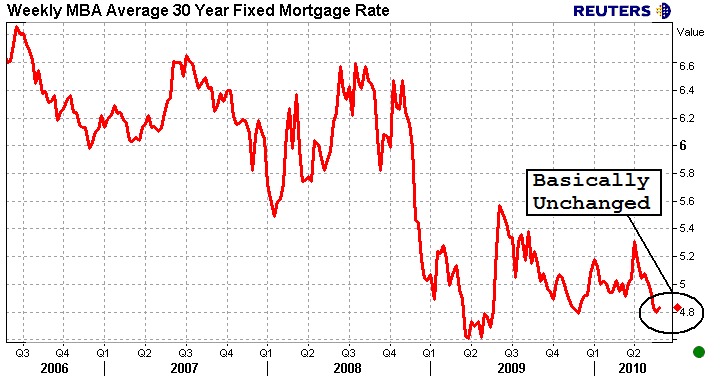
The average contract interest rate for 30-year fixed-rate mortgages increased to 4.83 percent from 4.80 percent, with points decreasing to 1.05 (including the origination fee) for 80 percent loan-to-value (LTV) ratio loans. The effective rate also increased slightly from last week.
The average contract interest rate for 15-year fixed-rate mortgages decreased to 4.24 percent from 4.25 percent, with points increasing to 1.11 (including the origination fee) for 80 percent LTV loans. The effective rate increased from last week due to the increase in points.
The average contract interest rate for one-year ARMs increased to 6.96 percent from 6.83 percent, with points decreasing to 0.27 (including the origination fee) for 80 percent LTV loans. The adjustable-rate mortgage (ARM) share of activity decreased to 5.2
percent from 6.0 percent of total applications from the previous week.
Ugh. This morning I talked about how all the optimistic data we've been hearing on housing is just "fine and dandy"...but was nothing unexpected. Homebuyer demand spiked at the end of the original tax credit in early November and it did the same thing at the expiration of the extended version of the homebuyer tax credit this April. No surprises!
The true barometer of the health of housing rests in May housing data..not April. If the recent downtrend in purchase apps holds any clue as to what sort of results we'll see in May, it won't be pretty. Anecdotal evidence is highly supportive of this theory. Heck, besides the drastic decline in purchase demand we've seen, pull-through on refi apps is poor thanks to the vast variety of hoops that must be jumped through before a loan can be cleared to close.
Working in this industry is no fun right now. Borrowers don't trust loan officers. Originators are losing deals for a measly $250 processing fee. Underwriters and appraisers are annoying each other to protect their own behinds. Meanwhile, secondary is fronting the bill and processors (a generally "testy" group to begin with) are stuck in the middle of it all. To make matters worse...Realtors are pointing the finger at mortgage professionals for the slowdown. I feel like my world is unraveling in front of me. Can't we all just get along?
HOUSING: THE GOOD, THE BAD AND THE UGLY
Best of luck to everyone in the months ahead.
UPDATED 6/3/2010
See comments added below by Mark Hanson...
Please forgive. "The true barometer of the health of housing rests in May housing data."
This is not exactly right. For NEW HOME SALES which get counted at contract, May is pivotal. May sales data are reported the 3rd week of June. But remember, many builders ran one-month post tax-credit $8k specials so perhaps June new home sales -- released the 3rd week of July -- will be a better indicator.
For EXISTING HOME SALES, which get counted at close the tax credit is still in effect through June 30th, therefore, July sales reported in the 3rd week of Aug, will give us our true gauge of the post-tax credit housing market. Also remember CA ha a $10k credit, which kicked in for closings after May 1st so the West could help pad things a bit but that will also be up by July sales, reported in Aug. Bottom line: you will have a lot to write about by August.