By Srinath Perera
Vice President - Research
A typical IoT system would comprise the architecture depicted in Figure 1; sensors would collect data and transfer them to a gateway, which in turn would send them to a processing system (analytics cloud). The gateway can choose either to or not summarize or preprocess the data. The connection between sensors and gateway would be via Radio Frequency (e.g. Zigbee), BLE, Wifi, or even wired connections. Often, the gateway is a mobile phone.
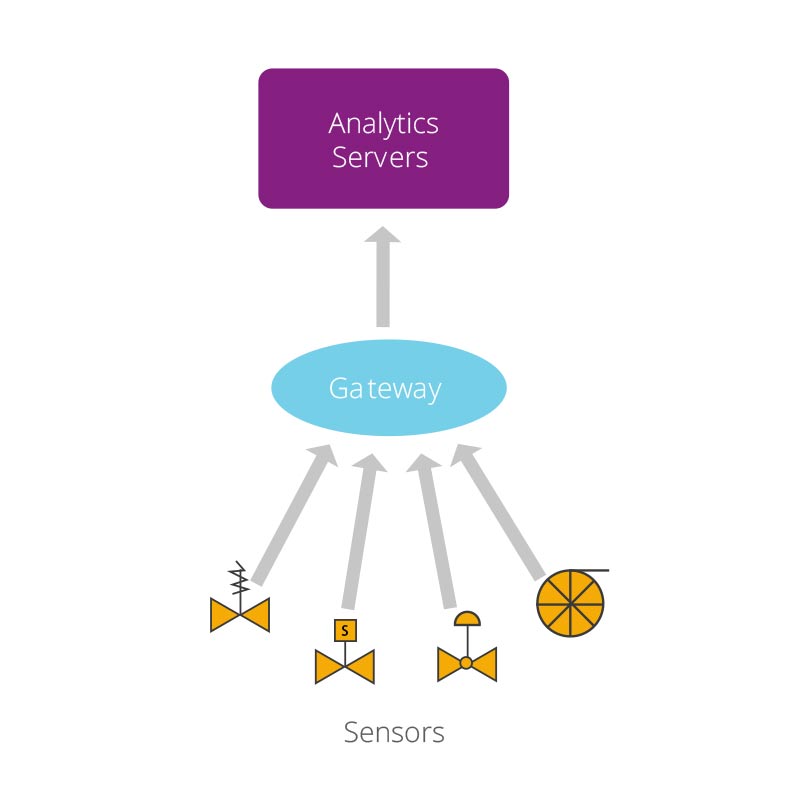
Figure 01
The connection from the gateway to the analytic servers would be via the Internet, LAN, or WiFi connection, and it will use a higher level protocol, such as MQTT or CoAp1 . Given that the focus of this paper is on IoT analytics, we won’t be delving too much into devices and connectivity. Assuming that part is done, how hard is it to figure out IoT analytics? Is it just a matter of offloading the data into one of the IoT analytics platforms or are there hidden surprises?
This white paper aims to explain the challenges and discuss how big data analytics is used to architect IoT solutions. ‘Big data’ efforts have solved many IoT analytics challenges, particularly system challenges related to large-scale data management, learning, and data visualizations. Data for ‘big data,’ however, came mostly from computer-based systems (e.g. transaction logs, system logs, social networks, and mobile phones). IoT data, in contrast, will come from the natural world, would be more detailed, fuzzy, and large. The nature of that data, assumptions, and use cases differ between old big data and new IoT data. IoT analytics designers can build on top of big data, yet the work would be far from being done. Let’s analyze a few key requirements that you would need to think about first.
This would generally depend on how fast you need results from the data gathered and your design changes and would vary according to each use case. You would need to consider if the value of your insights (i.e. results) would degrade over time and how fast this would happen, e.g. if you’re going to improve the design of a product using data, then you could wait days or even weeks. On the other hand, if you’re dealing with stock markets and other similar use cases where winner takes all, the milliseconds are a big deal.
Speed comes in several levels
Figure 2 summarizes those observations. It’s also likely that some use cases will fall under more than one in which case you would need to use multiple technologies.
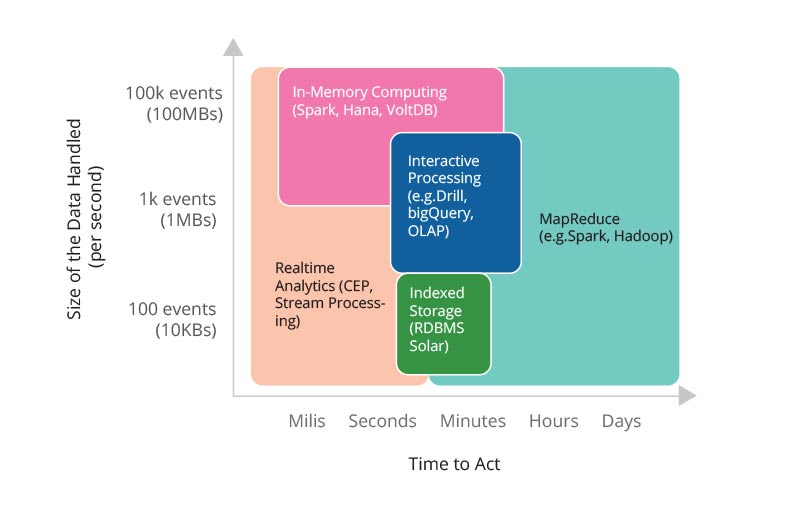
Figure 02
Next, we should decide how much data to keep and in what form. It is a tradeoff between cost versus potential value of data and associated risks. Data is valuable. In recent times, companies have been acquired just for their data, while Google and Facebook have gone to extraordinary lengths to access data. Moreover, you may find a bug or improvement in the current algorithm, and might want to go back and rerun the algorithm on old data. Yet, all decisions must be made considering the bigger picture and current limits. The choices are as follows:
The next question is where to do the processing and how much of that logic you should push towards the sensors. Pushing logic towards sensors will let your system scale further. There are three options as follows:
The IoT community already has the technology to push the logic to gateways. Most gateways are fully-fledged computers or mobile phones, and they can run higher level logic, such as SQL-like CEP queries. However, if you want to push code into sensors, in most cases, you would have to write custom logic using a lower level language like Arduino C. Another associated challenge is deploying, updating, and managing queries over time. If you choose to put custom low-level filtering code into sensors, there’s a likelihood this may lead to deployment complexities in the long run.
Hindsight, insight, and foresight are three questions that come to mind when dealing with data; to know what happened, to understand what happened, and to predict what will happen.
Hindsight is possible with aggregations and applied statistics. You can aggregate data by different groups and compare those results using statistical techniques, such as confidence intervals and statistical tests. A key component is data visualization that will show related data in context2.
Insight and foresight would require machine learning and data mining. This includes finding patterns, modeling current behavior, predicting future outcomes, and detecting anomalies. Refer to data science and machine learning tools (e.g. R, Apache Spark MLLib, WSO2 Machine Learner, GraphLab) for a deeper understanding.
IoT analytics will pose new types of problems and demand more focus on some existing problems. Some problems that are likely to play a key role in IoT analytics are as follows:
Most IoT data are collected via sensors over time. Hence, they are time series data, and often most readings are autocorrelated, e.g. a temperature reading is often highly affected by the earlier time step’s reading. However, most machine learning algorithms (e.g. Random Forests or SVM) do not consider autocorrelation. Hence, those algorithms would often do poorly while predicting using IoT data.
This problem has been extensively studied under time series analysis (e.g. ARIMA model). Moreover, in recent years, Recurrent Neural Networks (RNN) has shown promising results with time series data. However, widely used big data frameworks, such as Apache Spark and Hadoop, do not support these models yet. The IoT analytics community has to improve these models, build new models when needed, and incorporate them into big data analytics frameworks3.
Many IoT use cases like predictive maintenance, health warnings, finding plug points that consumes too much power, optimizations, etc., depend on detecting anomalies. Anomaly detection poses several challenges.
Once the data has been analyzed and actionable insights have been identified, you would need to decide on the next course of action. There are several choices to this end.
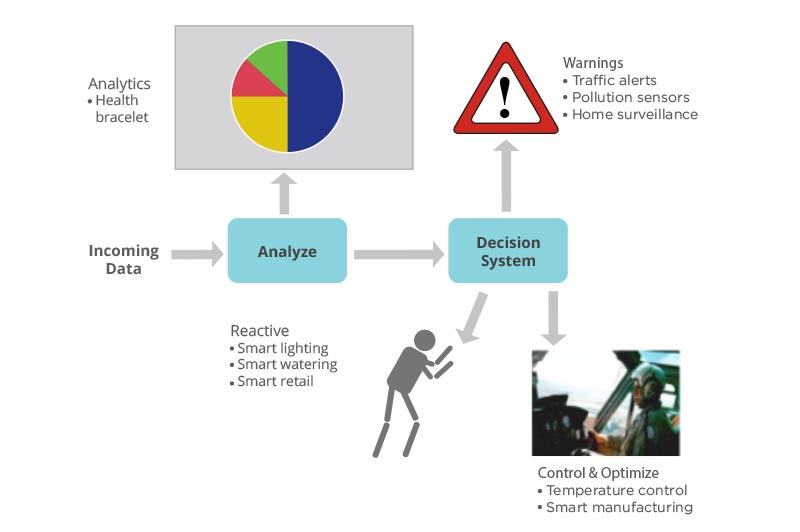
Figure 03
In general, the move towards automation is prompted by the need for fast responses (e.g. algorithmic trading). More automation can be cheaper in the long run, but is likely to be complex and expensive in the short run. As evidenced by stock market crashes, the associated risks cannot be underestimated. It is worth noting that carrying out automation with IoT will be harder than big data automation use cases. Most big data automation use cases either monitor computer systems or controlled environments like factories. In contrast, IoT data would often be fuzzy and uncertain. It is one thing to monitor and change a variable in automatic price setting algorithm. However, automating a use case in the natural world (e.g. an airport operation) is different altogether. If you decide to pursue the automation route, you need to spend a significant amount of time to understand, test, and re-test the scenarios.
Now that you’ve possibly got a good understanding of how IoT analytics work, let’s discuss the shape of common IoT data sets and use cases that arise from these.
Data from most devices would have the following fields:
The first use case is to monitor, visualize, and alert about a single device data. This use case focuses on individual device owners. However, more interesting use cases occur when you look at devices as part of a larger system like a fleet of vehicles, buildings in a city, a farm, etc. Among the aforementioned fields, time and location will play a key role in most IoT use cases. By using these two, you can categorize most use cases into two classes: stationary dots and moving dots.
Among examples of ‘stationary dot’ use cases are equipment deployments (e.g. buildings, smart meters, turbines, pumps, etc). Their location is useful only as a grouping mechanism, but the main goal is to monitor an already deployed system in operation. Some of the use cases are as follows:
Among examples of moving dot use cases are fleet management, logistic networks, wildlife monitoring, monitoring customer interactions in a shop, traffic, etc. The goal of these use cases is to understand and control movements, interactions, and behavior of participants as illustrated in this screencast - [Screencast] Analyzing Transport for London Data with WSO2 CEP.
Some examples are as follows:
For both types of use cases, it’s possible to build generic extensible tools that provide an overall view of the devices and provide out-of-the-box support for some of these. However, specific machine learning models, such as anomaly detection, would need expert intervention for best results. Such tools, if done right, could facilitate reuse, reduce cost, and improve the reliability of IoT systems. It is worth noting that this is one of the things that the ‘big data’ community did right. A key secret of big data success so far has been the availability of high quality, generic open source middleware tools. There’s also great potential for companies that focus on specific use cases or classes of use cases, e.g. Scanalytics focuses on foot traffic monitoring and Second spectrum focuses on sport analytics. Although expensive, they would provide an integrated, ready-to-go solution. IoT system designers have a choice to either opt for a specialized vendor or build on top of open source tools (e.g. Eclipse IoT platform, WSO2 Analytics Platform).
If you are looking to build your own analytics platform on top of a open source platform, WSO2 analytics platform can be a great fit.
The WSO2 Analytics platform combines into one integrated platform real-time and batch analysis of data with predictive analytics via machine learning to support the multiple demands of IoT solutions, as well as mobile and web apps. It also has the capability to organize and analyze data that would have been previously inaccessible or unusable. Moreover, it builds on the fast performance of the open source Siddhi CEP engine developed by WSO2 by adding streaming regression and anomaly detection operators to facilitate fraud and error detection.
As part of WSO2’s analytics platform, WSO2 Stream Processor has the ability to analyze data in motion. The comprehensive platform provides a single solution that enables developers to build systems and applications that collect and analyze information and communicate the results. It has been designed to treat millions of events per second, and is therefore capable to handle the volumes in big data and IoT projects.
As discussed, there are different aspects of an IoT analytics solution, particularly challenges you would need to consider when building or choosing an IoT analytics solutions. Big data has solved many IoT analytics challenges, especially system challenges related to largescale data management, learning, and data visualizations. Nevertheless, significant thinking and work is required to match IoT use cases to analytics systems. Among the highlights are how fast you need results, i.e. real-time or batch or a combination; deciding how much data should be kept based on use cases and the incoming data rate; deciding between aggregation and learning methods; and identifying your response once an actionable insight has been defined.
![]()
